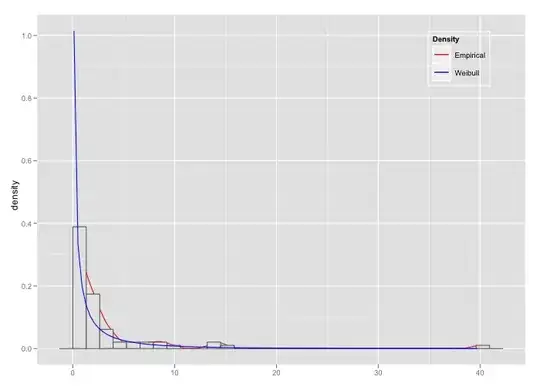
Let's suppose I have a set of measurements on a continuous variable which follows a power law distribution, and I’m interested in deriving the exponent of such a distribution.
So far I've used the binning method, so I was dividing the interval in n bins, plotting the number of observation for each bin in log-log scale and fitting a regression line trough the data. However this way of estimating the exponent is not enough accurate.
Now I’d like to move on and use the maximum likelihood method. But I’m a bit confused, maybe because I keep referring to the binning method. I know how to write the function of the expected theoretical distribution but I can’t visualize how to derive the empirical distribution. Can anyone point me in the right direction?
