I have a set of data, let's say average weight of employees, captured every month over a period of 5 years (2010 - 2014). I cannot find a seasonality trend in the data over these years. Also, I have found that it is not dependent on any other factors.
I am trying to forecast values for 2015 to get a general sense of this data as it is an important metric in the operations of my business.
I have tried ARIMA, R-regression, Exponential smoothing, Excel forecast to find any seasonality whatsoever. However, my efforts are yet to materialize.
My question is: How do I forecast a variable that has no seasonality?
I have attached my data herewith.
Graphs
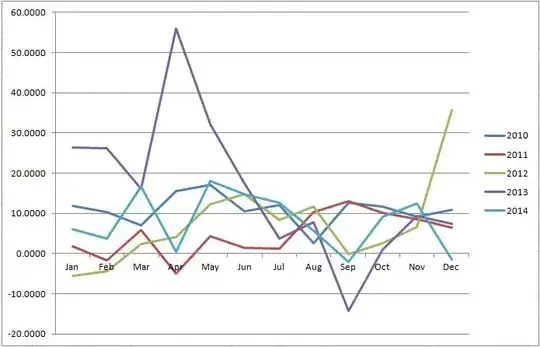
Yearly Values for years 2010 - 2014
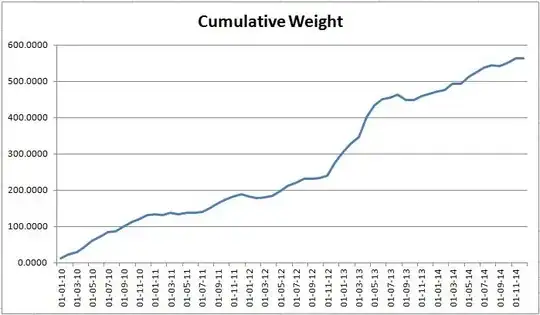
Value Cumulative over 2010 - 2014
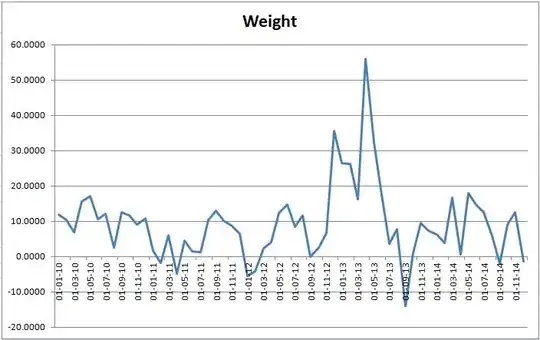
All Values from 2010 - 2014
Auto ARIMA in R
# Map 1-based optional input ports to variables
dataset1 <- maml.mapInputPort(1) # class: data.frame
library(forecast)


dates <-  dataset1$Date
values <- dataset1$Weight

dates <-  as.Date(dates, format = '%m/%d/%Y')
values <- as.numeric(values)

train_ts <- ts(values, frequency=12)
fit1 <- auto.arima(train_ts)
train_model <- forecast(fit1, h = 12)
plot(train_model)

# produce forecasting
train_pred <- round(train_model$mean,2)
data.forecast <- as.data.frame(t(train_pred))
#colnames(dataset1.forecast) <- paste("Forecast", 1:data$horizon, sep="")

# Select data.frame to be sent to the output Dataset port
maml.mapOutputPort("data.forecast");
Forecasted Value with Auto ARIMA
Date        Weight
01-01-15    11.77
01-02-15    11.76
01-03-15    11.77
01-04-15    11.76
01-05-15    11.77
01-06-15    11.77
01-07-15    11.76
01-08-15    11.77
01-09-15    11.76
01-10-15    11.77
01-11-15    11.77
01-12-15    11.76
Data
Date        Weight      Cumulative Weight
01-01-10    11.8800     11.8800
01-02-10    10.4000     22.2800
01-03-10    6.9500      29.2300
01-04-10    15.5000     44.7300
01-05-10    17.0400     61.7700
01-06-10    10.4700     72.2400
01-07-10    12.1400     84.3800
01-08-10    2.5800      86.9600
01-09-10    12.6300     99.5900
01-10-10    11.6800     111.2700
01-11-10    9.0700      120.3400
01-12-10    10.8900     131.2300
01-01-11    1.7500      132.9800
01-02-11    -1.7700     131.2100
01-03-11    5.9300      137.1400
01-04-11    -4.9200     132.2200
01-05-11    4.3900      136.6100
01-06-11    1.5100      138.1200
01-07-11    1.2200      139.3400
01-08-11    10.2900     149.6300
01-09-11    13.0600     162.6900
01-10-11    10.1400     172.8300
01-11-11    8.5250      181.3550
01-12-11    6.4350      187.7900
01-01-12    -5.5100     182.2800
01-02-12    -4.3000     177.9800
01-03-12    2.3200      180.3000
01-04-12    4.0700      184.3700
01-05-12    12.2700     196.6400
01-06-12    14.7400     211.3800
01-07-12    8.4600      219.8400
01-08-12    11.6300     231.4700
01-09-12    -0.1500     231.3200
01-10-12    2.5200      233.8400
01-11-12    6.7400      240.5800
01-12-12    35.6300     276.2100
01-01-13    26.4000     302.6100
01-02-13    26.1300     328.7400
01-03-13    16.2100     344.9500
01-04-13    56.0800     401.0300
01-05-13    32.2300     433.2600
01-06-13    17.5100     450.7700
01-07-13    3.6700      454.4400
01-08-13    7.7700      462.2100
01-09-13    -14.2800    447.9300
01-10-13    1.0800      449.0100
01-11-13    9.4000      458.4100
01-12-13    7.3400      465.7500
01-01-14    6.1400      471.8900
01-02-14    3.8200      475.7100
01-03-14    16.7600     492.4700
01-04-14    0.4900      492.9600
01-05-14    17.9800     510.9400
01-06-14    14.8000     525.7400
01-07-14    12.6400     538.3800
01-08-14    5.7300      544.1100
01-09-14    -2.0900     542.0200
01-10-14    9.1300      551.1500
01-11-14    12.5100     563.6600
01-12-14    -1.3900     562.2700
Actual Values for 2015
Date        Weight
01-01-15    -18.43
01-02-15    13.94
01-03-15    26.14
01-04-15    24.36
01-05-15    18.37