First off, I'm not very experienced in math techniques, so I am wide open to suggestions.
I am working with a set of data in R. I have a curve (mostly linear at first, peaking suddenly, then decreasing.) I want to smooth it out, so I used a spline and that achieves what I want (especially the peak of the curve "off center" from the top point). But there is a dip right below the peak that I want to avoid, as its essentially linear right there. 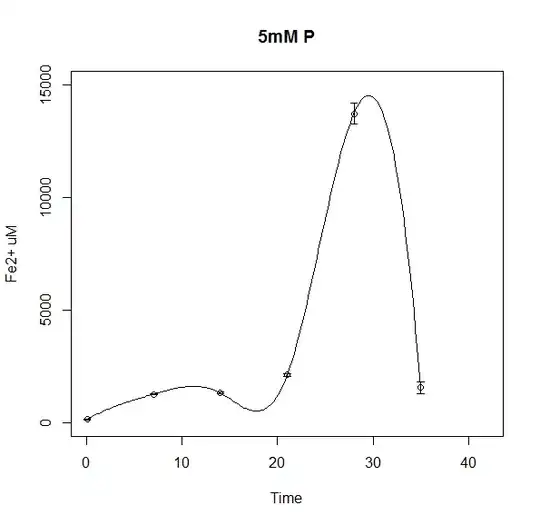
I kind of understand (in a non-mathematical way) why this dip has to be there, to give the curve enough time to angle upwards. But it doesn't represent that data.
Is there any way to avoid this dip? I've thought about graphing it as two separate lines (a linear and a curved one), but that isn't appealing. Is there something besides a spline? Or code I can use to get around this?
Edited to include data
Time           Fe2+
0.04    138.8181818
   7    1258.636364
  14    1320.545455
  21     2110.37037
  28    13730.37037
  35    1550.909091