5

I am using parallel analysis (Horn 1965) to determine how many principal components I can extract from my data. I can add more variables to my dataset, but I cannot add more cases (I know, that's weird, see below for some more context). Presently, using a fixed number of cases (77), and relatively few variables (17), I can only be parallel-analysis-certain about 2 components (because only those parallel-analysis discounted eigenvalues are > 1), which isn't great for my purposes. I am wondering whether it would make sense to add more variables to alleviate this problem, that is, whether that would allow me to retain more components, that pass muster under parallel analysis.

It seems obvious that the random data eigenvalues from a parallel analysis will grow as more variables are added; it becomes more likely that by random chance, two cases will be similar one some of the many variables. The question is: how fast do the random eigenvalues grow, as more variables are added. If they grow linearly, I'm screwed, and there is no point in adding more variables: as I add another variable, any improvement in (raw) eigenvalues will (probabilistically) be "eaten up" by an equal increase in necessary parallel-analysis adjustment. If they grow at a diminishing rate as you variables (is that a concave relationship then?!), there is hope: as you add more variables, only some, but not all of the possible increase in eigenvalues must be discounted away.

I have gone ahead and simulated this (very) crudely in R, and here's what I got:

library(paran)
library(reshape2)
library(ggplot2)
resparan <- matrix(data = NA, nrow = 400, ncol = 400)
for(i in 2:401) {
  rdata <- matrix(data = rnorm(n = 77, mean = 0, sd = 2.8), nrow = 77, ncol = i)
  resparan[1:i, i] <- paran(x = rdata, iterations = 100, centile = 95, quietly = TRUE, status = FALSE)$RndEv
  print(paste("Calculating for", i, "variables."))
  flush.console()
}
resparan.long <- melt(data = resparan, varnames = c("ncomps", "nvars"), value.name = "randomeigen")

Parallel Analysis N = 77

Parallel Analysis N = 200

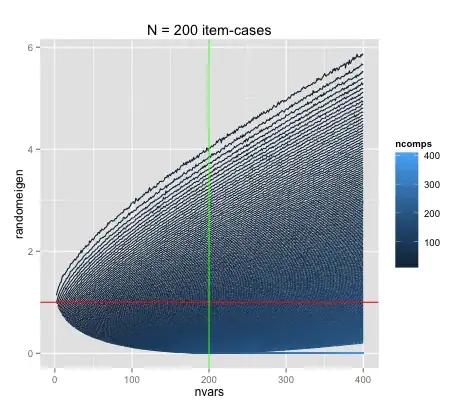
Above are two incarnations of the same plot, once for N (of item-cases) = 77, and once for N = 200. The point where the number of cases equals the number of variables is denoted by green line. The red line indicates Eigenvalue = 1, the Kaiser-Guttman criterion. It appears that the curvature extends up to the point where the number of variables equals the number of cases – does that make sense?

Note: don't do this at home, takes about 20mins or so.

It seems, that in fact, the relationship is not linear, and there is hope.

I am guessing that aside from this numerical simulation, there must be math to bear this out. Correct? What would be a source or proof for the non-linearity of random data eigenvalue growth as more variables are added?

Clarifications:

  • The actual, observed people-variables to be added will (hopefully) not be random. However, I am here not interested in the development of their unadjusted (or otherwise), observed eigenvalues: those are an empirical phenomenon. I want to know how eigenvalues from random data (which parallel analysis discounts by) develop, as more random variables are added. (That's what parallel analysis does: it runs PCA on many random datasets).
  • By construction (see below), the additional random variables all have the same variance and mean.

Why would anyone want to do this? (Some context).

I'm glad you asked. It's called Q Methodology (if anyone with sufficient privileges could add a new tag to that effect, that would be great). In Q methodology, people as people-variables are asked to sort a (<100) number of statements as item-cases under a normal distribution. (Because they must sort all items under a given (normal), forced distribution, the SD and mean of all Q-sorts as people-variables will be the same, in this case sd = 2.8 and mean = 0.)

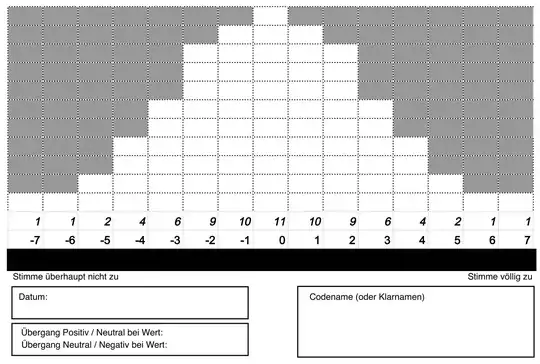
People place 77 cards with item-cases into the white boxes in the below template (unforunately in german). *The x-axis values of any given item-case is that case's value on the person-variable of that Q-sorter.

Q sorting template

You then extract factors (principal components, in my case) from the ranks of the cards, correlated across the people-variables. So it's basically like a normal factor analysis, but with a transposed data table. The idea is that the resulting factors (and their item-cases scores) can be interpreted as ideal-typical, shared viewpoints of people.

On the one hand, you want as many of such factors as possible, you decidedly don't care in Q by how many people any given viewpoint is shared. On the other hand, you do want to be certain that the viewpoint is really shared, and not just some random fluke, which you then interpret, making an ass of yourself in the process.

In this context, obviously, you cannot increase the number of item-cases above 100 or so, because people just can't be bothered with rank-ordering thousands of cards. You can, however, quite easily increase the number of variables, simply by having more people do the sorting.

Would that help?

I am quite fond of the rigorous standard of parallel analysis, I'm just not sure how it would translate to Q methodology.

Any and all suggestions and feedback would be very welcome, including explanations why my question is irrelevant / ill-formed, etc.


PS: it would be really nice if this could work. Not only would it allow a quite rigorous type of Q methodological work, it would also allow us to have some hunch about the necessary number of people-variables depending on the number of item-cases and desired number of components to be retained (if detected).

maxheld
  • 702
  • 1
  • 6
  • 18
  • The answer must depend on the covariances between the new variables and the existing variables. You will need to assume something quantitative about that in order to develop any growth estimates. – whuber Jun 23 '15 at 16:56
  • 1
    thanks @whuber. I am not sure I follow: I understand that I would have to know about the covariance of the *actual*, *observed* additional variables to estimate their eigenvalues (adjusted or otherwise). I don't understand why I would need that for simulating additional *random* variables (their covariance should be close to 0, because they're random data). Parallel analysis, as I understand it, is not based on the real data anyway, but on (again) random data with the same SD, mean, and number of variables and cases. – maxheld Jun 23 '15 at 19:29
  • I am for now merely interested in how eigenvalues from *randomly generated* data change, as more (random) people-variables are added, with a constant number of item-cases. – maxheld Jun 23 '15 at 19:31
  • 1
    I still don't see any place in this question where you stipulate that the added variables are random and independent of the previous ones: it would be a good idea to emphasize that important condition. You certainly will also need to make some assumptions about their variances. After all, by including one high-variance random variable you could introduce a large new eigenvalue--but that wouldn't be of much interest. – whuber Jun 23 '15 at 19:33
  • I apologize for not making myself clearer. I've added a clarification to that effect. – maxheld Jun 23 '15 at 19:49
  • 3
    I can't quite be sure I'm following correctly, but this paper on the distribution of the largest eigenvalue may be relevant: http://statweb.stanford.edu/~imj/WEBLIST/2001/LargestEigPcaAnnStat01.pdf There seems to be quite a few papers subsequently written on the subject. – Matthew Drury Jun 23 '15 at 23:19
  • When you run your parallel analysis, you are probably preserving variances of the original data. This means that random eigenvalues will depend on these variances (as @whuber has remarked in his last comment). Can you assume anything about them? In your simulation you seem to add variables with SD=2.8; why 2.8? If you were to run your analysis on correlation matrix, then all SDs would be 1, and the problem would be better defined. Currently, you can add one more variable that happens to have huge variance, and this will blow up your parallel analysis eigenvalues too. – amoeba Jun 28 '15 at 13:05
  • @amoeba @whuber by construction (see context), all (additional, random) variables (which are people's Q-sorts under a forced distribution) have **the same standard deviation (`2.8`) and mean (`0`)**. This is the standard deviation that corresponds to `N=77` items. Given the methodology (forced distribution Q sort), we can always assume that the SD and mean will be the same. Does that help at all? (I added a clarification to this effect) – maxheld Jun 29 '15 at 08:58
  • 1
    I don't really understand where the number 2.8 comes from, but this clarification certainly makes your question more tractable. Have you heard of [Marcenko-Pastur distribution](https://en.wikipedia.org/wiki/Marchenko%E2%80%93Pastur_distribution)? It explicitly describes the distribution of eigenvalues of a covariance matrix of a random $n \times m$ matrix where each element $x_{ij} \sim \mathcal N(0, \sigma^2)$. You seem to be interested in how the largest eigenvalue will grow (is that right?) and that's a bit more difficult then, but one can quickly simulate it from Marcenko-Pastur. – amoeba Jun 29 '15 at 09:08
  • @amoeba `2.786796` is the SD, by construction, of the above Q-sorts (I added a picture and some explanation above). Thanks for the pointer to the [Marchenko-Pastur](https://en.wikipedia.org/wiki/Marchenko–Pastur_distribution) distribution; that seems promising, though my (non-existent) command of random matrix theory strictly limits my understanding of it. I loaded `library(RMTstat)` and am guessing sth. like `sort(rmp(n = 77, pdim = 17, ndf = 12), decreasing = TRUE)` should give me the random evs, though I am unsure how to specify the arguments to that function (what are `ndf` in here?) – maxheld Jun 29 '15 at 10:53
  • 1
    I, in turn, don't know anything about R, but [it seems](http://cran.r-project.org/web/packages/RMTstat/RMTstat.pdf) that `ndf` should be 77 (it's your $N$), `pdim` is the number of variables, and you should also specify `var=2.8`. Input parameter `n` is just a number of random variables you want to generate; if you want a whole eigenvalue spectrum it probably should be equal to 77, because that's how many eigenvalues you get from one random dataset. – amoeba Jun 29 '15 at 11:18
  • thanks again @amoeba – I am still confused about `n`, `pdim` and `ndf`. Given that I always have **77 observations** (in Q: *item-cases*) and --- initially --- **17 variables** (in Q: *people-variables*), shouldn't the maximum number of eigenvalues be **17**? Results of `sort(rmp(n = 17, pdim = 17, ndf = 77, var = 2.8^2), decreasing = TRUE)` are still weird, because they don't add up to `17`, as they must, as eigenvalues. I guess I'm outmatched by this problem. – maxheld Jun 29 '15 at 11:30
  • My original question was basically simple: Does it make sense to *add* more vars (with same sd, mean), given fixed obs, or will parallel analysis (as a retention criterion) "eat up" all possible gains from more observed variables. Hence the concern how *random* eigenvalues increase, as more random variables are added (which is what the parallel analysis would do on an observed dataset with more vars, but same number of cases). – maxheld Jun 29 '15 at 11:30
  • @MatthewDrury that paper seems to be quite on point, just (tried to) read it. It's more than I can chew, mathematically, to be sure of what it (or downstream publications) might imply. – maxheld Jun 29 '15 at 11:50
  • Why would the eigenvalues add up to 17? Variance of each variable is 2.8^2, so total variance is 17*2.8^2. Or are you doing your analysis on the correlation matrix, i.e. normalize all variables by their variances? – amoeba Jun 29 '15 at 12:10
  • Uh, darn – I thought eigenvalues *always* add up to the number of variables, but apparently, that is the case only for doing the extraction on the correlation matrix (which I am, indeed, doing). – maxheld Jun 29 '15 at 16:14
  • Eigenvalues add up to the trace (sum of the diagonal values) of the covariance matrix. If it's actually a correlation matrix then all diagonal elements are 1, so the trace equals the number of variables. If it's a covariance and not a correlation matrix, then its trace can be anything. If you do PCA on the correlation matrix, you should (a) make sure that you do parallel analysis also on the correlation matrices, and (b) update your question accordingly. The individual variances are then of no importance. – amoeba Jun 29 '15 at 22:04

0 Answers0