16

I would like to know how to transform negative values to Log(), since I have heteroskedastic data. I read that it works with the formula Log(x+1) but this doesn't work with my database and I continue getting NaNs as result. E.g. I get this Warning message (I didn't put my complete database because I think with one of my negative values is enough to show an example):

> log(-1.27+1)
[1] NaN
Warning message:
In log(-1.27 + 1) : NaNs produced
> 

Thanks in advance

UPDATE:

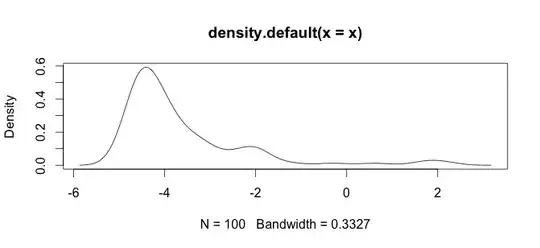
Here is an histogram of my data. I'm working with palaeontological time series of chemical measurements, E.g the difference between variables like Ca and Zn is too big, then I need some type of data standardization, that is why I'm testing the log() function.
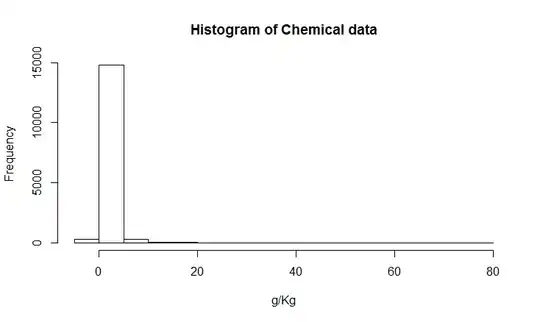
 enter image description here

This is my raw data

Darwin PC
  • 459
  • 2
  • 4
  • 10
  • 2
    The logarithm is only defined for positive numbers, and is usually used as a statistical transformation on positive data so that a model will preserve this positiveness. The `log(x+1)` transformation will is only defined for `x > -1`, as then `x + 1` is positive. It'd be good to know your reason for wanting to log transform your data. – Matthew Drury Jun 04 '15 at 04:58
  • It is because Into my database I have some extreme values, and when I plot a histogram almost all data bars are grouped at left. I would like to have a better data distribution to plot it in a heatmap. – Darwin PC Jun 04 '15 at 05:06
  • What variable are you measuring? It's presumably not a count or frequency, but perhaps it is temperature? In which case converting to Kelvin will ensure it is non negative. Or is it difference data (e.g. Stock price change from previous day)? – tristan Jun 04 '15 at 06:02
  • 3
    Tell us more about the data, including the range, mean, frequencies of negative, zero and positive values. It could be that a generalized linear model with log link makes most sense for the data so long as it is reasonable to think that the mean response is positive. It could be that you should not be transforming at all. – Nick Cox Jun 04 '15 at 06:34
  • 1
    In practice getting the right functional form for the relationship is much more important than getting a convenient error structure. Heteroscedasticity can be dealt with by changing the estimation procedure, not just by transformation. Also cube roots can cope with positive, zero and negative numbers. – Nick Cox Jun 04 '15 at 06:39
  • For clarity I updated my question with a histogram of my data. – Darwin PC Jun 04 '15 at 06:56
  • 7
    Thanks for adding details. For such data **0 has a meaning (equality!) that should be respected, indeed preserved**. For that and other reasons I would use cube roots. In practice, you will need some variation on `sign(x) * (abs(x))^(1/3)`, the details depending on software syntax. For more on cube roots see e.g. http://www.stata-journal.com/sjpdf.html?articlenum=st0223 (see esp. pp.152-3).We used cube roots to help visualization of a response variable that can be positive and negative in http://www.nature.com/nature/journal/v500/n7464/full/nature12382.html?WT.ec_id=NATURE-20130829 – Nick Cox Jun 04 '15 at 07:54
  • Note that "Kg" should strictly be "kg" in your graph. – Nick Cox Jun 04 '15 at 07:54
  • 1
    Your use of R is secondary here. The same issues arise regardless of the software being used and software-specific questions would be off-topic here in any case. I edited the title accordingly. – Nick Cox Jun 04 '15 at 07:58
  • 9
    Why aren't you transforming the *original* variables instead of the differences? – whuber Jun 04 '15 at 08:23
  • 1
    @whuber has a penetrating comment as usual. It could be that $\log (x / y) = \log x - \log y$ makes more sense, i.e. the skewness in the original variables would be much improved and $x = y$ maps simply to $\log x - \log y = 0$. Clearly $x$ and $y$ must still be positive. – Nick Cox Jun 04 '15 at 08:33
  • 1
    This question merits a better title. It seems its essence is in how to transform data to remove heteroskedasticity, not just how to take a logarithm of a negative number (which does not make sense, at least in simple mathematics). – Richard Hardy Jun 04 '15 at 14:12
  • Your raw data consists a variable indicating year and 138 variables with anonymous names var001-var138 (itself poor data management practice, unless you are being coy on purpose). I think to get us interested, and to keep the discussion focused, to need at an absolute minimum to nominate one of two variables which concern you. – Nick Cox Jun 05 '15 at 07:29
  • My data have chemical and climate variables, and I put intentionally anonymous names. At the moment I want to prepare this data before to do PCA and plot this with heatmap2( ) . That is why first I'm trying to test the logarithmic transformation. – Darwin PC Jun 05 '15 at 07:56
  • 1
    You need to motivate people, who do this for free and only because they find it interesting! If you tell me that the graph above is based on `var042` minus `var065`, or whatever, then I and everybody else have something to discuss. Otherwise I can't see what you are expecting or asking us to do beyond what we have suggested. Nor are you responding to any of the specific suggestions already made. It's already established that log() is pointless unless for positive arguments. – Nick Cox Jun 05 '15 at 09:34
  • Unfortunately, these are not the raw data: they are the differences. The raw data would be the *original* chemical measurements. Your analysis will be more successful starting with those. – whuber Jun 05 '15 at 15:53
  • Dear @NickCox thanks for your suggestions, apparently my problem was simple maths, I just changed the 1 from my initial formula `log(x+1)` to another constant (the minimum value) as explained Jeromy Anglim [here](http://stats.stackexchange.com/questions/94628/how-to-transform-negative-data-to-be-homoscedastic), it is `log(x+C)`. Now the logarithmic transformation works great with my data, of course it is transforming the negative to positive first. Regarding to transform data to remove heteroskedasticity I have to formulate a new question. – Darwin PC Jun 06 '15 at 01:47
  • 4
    You solved the mathematical problem. @whuber's suggestion or cube roots would still, I think, be easier to work with, especially if the constant is purely empirical or varies between variables. A good rule for choice of transformations is only to use transformations that would work for similar data you can imagine. Thus $\log(x + 4)$ "works" for $x > -4$ but would fail if your next batch was bounded by $-5$.. – Nick Cox Jun 06 '15 at 07:00

2 Answers2

17

Since logarithm is only defined for positive numbers, you can't take the logarithm of negative values. However, if you are aiming at obtaining a better distribution for your data, you can apply the following transformation.

Suppose you have skewed negative data:

x <- rlnorm(n = 1e2, meanlog = 0, sdlog = 1)
x <- x - 5
plot(density(x))

then you can apply a first transformation to make your data lie in $(-1,1)$:

z <- (x - min(x)) / (max(x) - min(x)) * 2 - 1
z <- z[-min(z)]
z <- z[-max(z)]
min(z); max(z)

and finally apply the inverse hyperbolic tangent:

t <- atanh(z)
plot(density(t))

Now, your data look approximately normally distributed. This is also called Fisher transformation.

stochazesthai
  • 4,616
  • 2
  • 18
  • 26
  • 10
    You solved the immediate mathematical problem. But I don't think most likely consumers of statistical results would find it easy to think about $\text{atanh}[(x - \min(x)) / (\max(x) - \min(x))]$ as a response scale and in modelling you would need to think what error structure makes sense.The scale would be sensitive to the empirical minimum and maximum. – Nick Cox Jun 04 '15 at 06:38
  • 2
    @NickCox You are absolutely right. Maybe if the OP add more details about his problem, we could figure out an alternative solution! – stochazesthai Jun 04 '15 at 06:43
  • The inner argument in my first comment is **not** what is being transformed, but the spirit of my comment is I think unaffected. – Nick Cox Jun 04 '15 at 08:35
  • Dear @stochazesthai thanks for your detailed explanation, but I can't apply your code to my data. I updated my question with a link of my raw data at the end. – Darwin PC Jun 05 '15 at 06:18
  • 1
    The statements `z – Max Ghenis Aug 07 '18 at 19:39
-1

To transform it to a log scale, first find the log of the positive number then multiply it by its sign, the following code should do that.

transform_to_log_scale <- function(x){
    if(x==0){
        y <- 1
    } else {
        y <- (sign(x)) * (log(abs(x)))
    }
        y 
    }

Using the above example we can plot the following skewed distribution

x <- rlnorm(n = 1e2, meanlog = 0, sdlog = 1)
x <- x - 5
plot(density(x))

enter image description here

After using the transforming function as follows, we get a distribution that looks more 'normal'

plot(density(sapply(x,FUN=transform_logs_scale)))

enter image description here

yosemite_k
  • 115
  • 3
  • 4
    (1) Most programming languages (`R` included) implement the *signum* function (which returns -1 for negative numbers, 1 for positive numbers and 0 for zero). Using it would be more expressive and faster. (2) Your proposal is a poor one for analyzing data like those illustrated, because it has a huge discontinuity at zero! – whuber Jul 29 '17 at 20:54
  • thanks for signum, i didn't know about it, wonder how it is implemented – yosemite_k Jul 29 '17 at 21:01
  • 3
    There are various ways. In many processor architectures a sign bit is set after many operations, so it could be used. In the IEEE double precision floating point representation, the sign can be found by inspecting a single bit (plus another quick test for a true zero). In pipelined architectures with predictive branching, etc., it's usually much more efficient not to branch if at all possible, which is why using the built-in version of *signum* can be a significant computational gain. Incidentally, setting `y – whuber Jul 29 '17 at 21:09