3

Lets say I want to take the usual funnel plot for meta-analysis, and add another dimension to it, visually changing the points used for each study by a covariate. While it might be easier to change the marker or color for categorical variables, for a continuous variable, this gets a little harder.

Lets say we want to see if there's obvious asymmetry not just overall, but by say, length of follow-up. Does anyone know a way in either R or Stata to either change the size of the points plotted - so you essentially have a funnel-bubble plot, or to color them on a continuous gradient?

Clearly, this can be done by just modifying a scatterplot, but I'd like to save the steps in manipulating the access to get it looking like a conventional funnel plot.
Fomite
  • 21,264
  • 10
  • 78
  • 137

1 Answers1

7

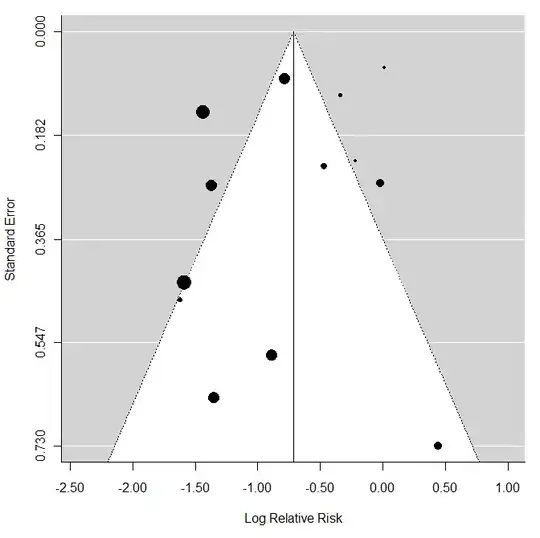
You can do that with the funnel() function from the metafor package. Here is an example:

library(metafor)

data(dat.bcg)
res <- rma(ai=tpos, bi=tneg, ci=cpos, di=cneg, data=dat.bcg, measure="RR", method="REML")

ablat.scaled <- with(dat.bcg, (ablat - min(ablat))/(max(ablat) - min(ablat)))
ablat.scaled <- ablat.scaled * 2 + 0.5

funnel(res, cex=ablat.scaled)

Resulting figure shown below. Adapt to your taste.

funnel plot with asymmetrical point sizes

Wolfgang
  • 15,542
  • 1
  • 47
  • 74
  • Outstanding! Two questions - is there any chance you can go through what the code does a little bit? I confess R is still a touch...opaque to me. Secondarily, can metafor calculate measures of funnel plot asymmetry using those weighted points? – Fomite Sep 12 '11 at 23:52
  • Answering my own question, it appears that metafor can handle modifying factors (like whatever the points are scaled by) as part of a regression test of funnel plot asymmetry. Could you confirm my understanding is correct? – Fomite Sep 13 '11 at 03:19
  • Regarding what the code does: `data(dat.bcg)` to load the `dat.bcg` dataset. With `res – Wolfgang Sep 13 '11 at 21:51
  • Regarding measures of funnel plot asymmetry: You can do the regression and rank correlation test (functions `regtest` and `ranktest`). The regression test allows you to specify a model that already includes one or more covariates/moderators (such as length of follow-up). – Wolfgang Sep 13 '11 at 21:56
  • Sorry for the resurrection, but I've been reading through the article on metafor. As I understand it, regtest and ranktest can use the covariates/moderators to try to explain some of the asymmetry. What I'm looking for is a way to *weight* the studies by a moderator. So for example, if one study had 10 years of followup, and another had 5, the first study would count twice. If all the heavily weighted studies appeared on one side of the funnel it would be asymmetrical, even if the unweighted version wasn't. Any idea how to approach that? – Fomite Sep 21 '11 at 05:08
  • The metafor package currently does not support the use of user-defined weights if that is what you want. However, if you just want to create a funnel plot in the way you describe, why not use create a regular funnel plot based on model without the moderator and then use the `cex` argument to indicate the follow-up length? – Wolfgang Sep 21 '11 at 20:10
  • That's what I'd be doing for the original question. This was more of a follow-up/extension of the original question, which you vary ably answered. But what I want to do can be accomplished with...acceptable ease...outside metafor. It was just worth checking with the package creator in case I missed a bit of documentation :) – Fomite Sep 21 '11 at 20:17
  • I am curious how you would go about doing that with other functions/packages (I assume you are referring to the use of user-defined weights for the meta-analytic fixed- and random/mixed-effects models). What have you tried? – Wolfgang Sep 23 '11 at 09:18
  • I should have been more clear. With acceptable ease in theory. I was probably going to throw SAS at the problem and see what I could come up with - it handles user-defined weights fairly well generally. I'll let you know what I come up with when I do. – Fomite Sep 23 '11 at 09:31
  • Ah, okay. You definitely can fit random/mixed-effects models with `proc mixed` in SAS (see, for example, [link](http://onlinelibrary.wiley.com/doi/10.1002/%28SICI%291097-0258%2819990215%2918:3%3C321::AID-SIM28%3E3.0.CO;2-P/abstract)). I suppose with the `weights` statement, you could add user-defined weights. Not sure about the details though. – Wolfgang Sep 23 '11 at 13:45