I'm trying to find the estimates for $alpha$ and $beta$ of the beta distribution (red curve) that will fit the black curve (empirical) better.
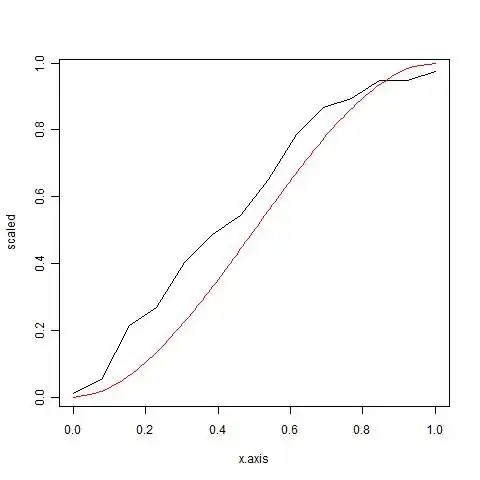
I have a function that finds "non-parametric" inverse cumulative function of my data (boot.mean). I would like to find a distribution that would fit. So far, I think cumulative beta distribution (alpha = beta = 2) could somehow be used. I would love to see a distribution that fits the bill better, though...
# raw data produced by a function (inverse cumulative distribution)
boot.mean <- c(37.021, 35.051, 29.091, 27.094, 22.058, 18.994, 16.944, 12.897, 7.903, 4.926, 3.939, 1.94, 1.94, 0.968)

#"fidge" (not sensu Climategate) boot.mean for comparison to qbeta
scaled <- 1 - (boot.mean/boot.mean[1])
scaled[1] <- 0.01 #dreader zero be gone
range(scaled)
 [1] 0.0100000 0.9738527

# this is the theoretical curve
x <- seq(0, 1, length = 100)
y <- qbeta(x, shape1 = 2, shape2 = 2)

# all along the x axis
x.axis <- seq(from = 0, to = 1, length = length(scaled))

# plot empirical and the theoretical values
plot(x.axis, scaled, type = "l")
lines(y, x, col = "red")

# I'm just an x-con trying to fit a distribution to my data
(beta.fitted <- MASS::fitdistr(x = scaled, densfun = qbeta, start = list(shape1 = 2, shape2 = 2)))
 Error in optim(x = c(0.01, 0.0532130412468599, 0.214202749790659, 0.268145106831258,  :
   non-finite finite-difference value [2]
 In addition: There were 50 or more warnings (use warnings() to see the first 50)