7

Lets suppose I have a have a survival curve from 0 to 6000 days using Kaplan -Meier curves. How would I be able to project future survival rates from 6001 and forward ? Is there a function or extrapolation method I can use ?

Below is an example, this is for illustration only:

library(survival)
library(ISwR)
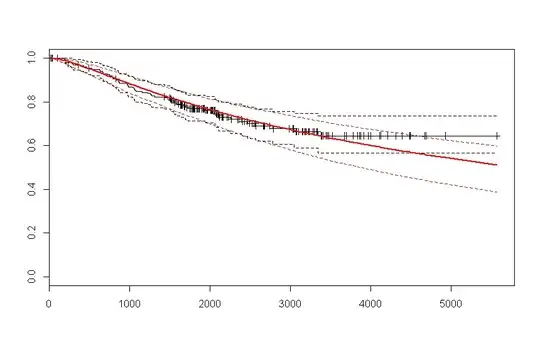
mfit <- survfit(Surv(days, status == 1)~1, data = melanom)

How to project the curves beyond on what is observed below ?

enter image description here

EDIT:

Based on the great response from @CliffAB, I would like to add-on to the question above:

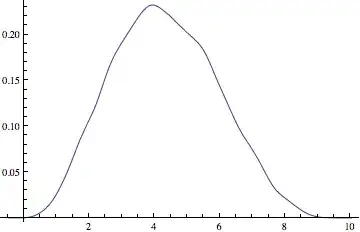
What if we assume its a parametric model (vs. non parametric KM curves) and a distribution, for instance for the same data above, I assome a log normal distribution and run the data, can I use a survival function of the assumed distrubution to project the data ?

require(flexsurv)
parm.curves  <- flexsurvreg(Surv(days, status == 1)~1,dist='lnorm',data=melanom)
plot(parm.curves)

enter image description here

The data that I'm working on is more on cutomer retention and it does not behave like the above data. Its just for an illustrative purpose only. But just shows it is difficult to project these type of problems. My question is, can we use assumed distribution survival function to project future survival rates ?

Thanks

forecaster
  • 7,349
  • 9
  • 43
  • 81

1 Answers1

7

As far as I am aware, there is no way to extrapolate beyond that point with standard R-software.

And with good reason too: the Kaplan Meier curves do not make assumptions about the parametric distribution of the data. Because of this, they are complete indifferent to the assignment of probability mass beyond the last observed event.

I'm glossing over some details here, but suppose in your dataset, only 30% of subjects are observed to have had events. You would be hard pressed to estimate the 90% percentile without making very strong assumptions about the parametric family the data was generated from. So if you really want to make estimations beyond t = 6,000, you will probably need to switch to a parametric estimator (also, you should be very skeptical about those estimates!!)

Cliff AB
  • 17,741
  • 1
  • 39
  • 84
  • Thanks for your answer. The example provided in my question is for illustrative purpose only. Do you mean to say that there is no way to project the data even if the curve stops let's say at 2000 in the above example? – forecaster May 14 '15 at 00:30
  • 1
    +1 - given the nature of the question the OP may be interested in "cure" survival models, which attempt to estimate the proportion of individuals that will survive. With typical hazard models the probability of survival always goes to zero in the limit with time. – Andy W May 14 '15 at 11:44
  • The difficulty is shown in the example and the comment from @forecaster. Without information beyond t = 2000, survival would be well fit by a linear relation to time, which would then significantly underestimate survival at times greater than 4000 or so. Unless you know for sure the shape of the survival curve (parametric representation), you can't do this. As the great philosopher Yogi Berra is alleged to have said, “It's tough to make predictions, especially about the future.” – EdM May 14 '15 at 15:45
  • 1
    forecaster, in response to extending beyond a given time point, Kaplan Meier Curves do not give well defined estimates after the last observed event. So in your example, the last observed event was around t = 6,000. This KM curve estimates that about 60% of the events occur before t = 6,000, but is not informative beyond than that. To try to make estimates about what happens beyond t = 6,000 is very dangerous: you literally have no information about when events occur given that they have not occurred by t = 6,000. So yes, there is no robust way of predicting beyond t = 6,000 in this example. – Cliff AB May 14 '15 at 17:58
  • Thanks @CliffAB for clarifying comments. I have modified the question, can you please let me know if parametric curves could be used for projection, and what are the limitations/caveats for parametric projection. – forecaster May 14 '15 at 19:43
  • The quick answer on how to use the parametric estimator for projection would be to fit the data, extract the estimated baseline parameters and coef's (in your example, there are no coefs, but in your real data there very well may be). Using these estimates, you should be able to properly identify the estimated distribution of an individual, (i.e. event time is distributed dlnorm(mu = 2, sd = 3) from our fitted model, for example) and then use the 'q' function to get your survival survival curves (i.e. qlnorm(.9, mu = 2, sd = 3) would be the estimated 90th percentile). – Cliff AB May 14 '15 at 20:38
  • 2
    Caveats: The real data may not follow the assumed distribution and thus your estimates could be very biased! And it's hard to inspect this assumption if much of your data is censored. In fact, I would guess that's exactly the scenario in your real data. If you are interested in customer retention, you are probably estimating "time until customer return". If that's the case, then the cure-rate that Andy W mentioned may well be a much better fit than a standard model: there's a percentage of customers that essentially never return and truthfully, that's probably what you're more interested in! – Cliff AB May 14 '15 at 20:43
  • Perfect, Thanks for your effort in answering my question. – forecaster May 14 '15 at 21:54