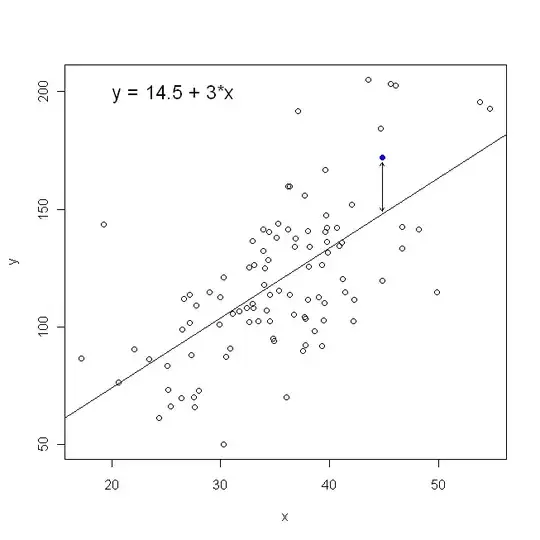
Simple question, has anybody ever seen a similar visualization to the one below? If so what is the name of such a graph and what software could be used to create it?
Simple question, has anybody ever seen a similar visualization to the one below? If so what is the name of such a graph and what software could be used to create it?