For a line graph, it behaves linearly upto a particular point and varies exponentially after it. Please suggest me a statistical approach/test to know this threshold point.
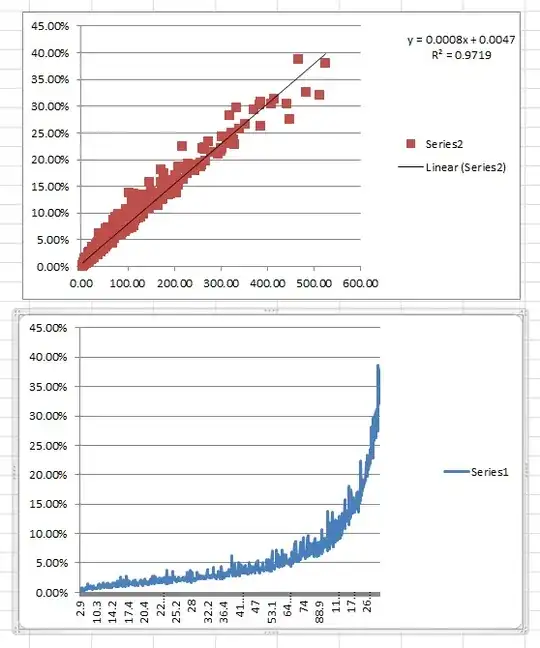
When I plot a scatter plot I see a linear trend as seen in the plot.
For same data when I plot a line graph I see a linear trend upto a certain threshold point and then an exponential trend. So basically I am trying to find out this point from where the behaviour changes.
The actual dataset is huge around 500 observations( therefore can't share)
Asked
Active
Viewed 542 times
4
kjetil b halvorsen
- 63,378
- 26
- 142
- 467
Pratik
- 41
- 2
-
5Exponential function is quite linear when close to zero: $e^{\delta x}=\delta x+O(\delta x^2)$. Are you sure that's not the case? – Aksakal May 11 '15 at 13:22
-
6Any "statistical approach" would, by definition, use *data*. What are your data like? What do they represent or measure? – whuber May 11 '15 at 13:32
-
1It's not quite clear what the two different x-axes are in the plots you now show. Please explain what's going on. The y-axis appears to be a percentage -- is it a count-percentage (like proportion of cows with horns) or a continuous percentage (percentage of cream in milk)? – Glen_b May 12 '15 at 13:28
-
i have two variables one in seconds(x) and the other(y) is in percentage(count percentage) – Pratik May 13 '15 at 04:39
2 Answers
4
Edited for changes in question:
you still don't specify if the model should be smooth at the join (which reduces the model degrees of freedom), or can have a kink in it.
it looks like the variation in the second plot increases with whatever the variable on the $x$-axis is. You should also explain something about how you think the variation of the data about the model is expected to work.
one approach which is suitable for a constant (or reasonably so) variability about the model is nonlinear least squares, though there are other ways to approach this sort of problem.
There are some posts on site outlining this or other approaches to this sort of model on CV. For example this answer gives a minimal changepoint example using nonlinear least squares done in R; a simple example is also in this one. The exponential-linear case can be done in just the same fashion.
It might perhaps make some sense to work on the log-scale -- it's still going to be a combination of nonlinear and linear but it might help stabilize variance. On the other hand, if your data are count-percentages, a different scale might do better.
With some additional clarification, some more detail may be possible.
-
2Except the "data" are utterly unrealistic - they contains no variation, and don't match the stated model, so give no additional insight into what you want, since any incidental features may be an artifact of the fact that they're made up, are not exponential and have no randomness. What additional detail do they convey? (Equispaced x's?) – Glen_b May 12 '15 at 08:33
-
If you want a set of integer y's that are linear on the left and essentially exponential on the right, something like `6 18 30 42 54 69 88 112 142 180` would come much closer. Still doesn't really have noise, but at least it matches the description. – Glen_b May 12 '15 at 08:49
-
so if the data that you have provided is taken into consideration, we find that with observation "54" the behaviour changes to exponential. Here 54 is our threshold point. how do we arrive at this threshold point using a statistical approach. – Pratik May 12 '15 at 09:02
-
Actually I made my example deliberately ambiguous, since the threshold could equally be argued to be 42, or indeed, somewhat left of 42 or right of 54... – Glen_b May 12 '15 at 09:13
3
You can set the threshold as a parameter in your model. The model will have these components: (1) linear part up to the threshold, (2) exponential part above the threshold, (3) the condition that the value of the two "sub-models" is identical at the threshold.
You can then find the parameter values by likelihood optimization, or by MCMC. Of course, in order to calculate the likelihood, you will need to come up with the appropriate error structure (the stochastic part of the model), which will depend on the nature of your data.
Petr Keil
- 116
- 3