2

The function powerTranform from the "car" package in R mentions the following code for Box-Cox transformation for multiple regression:

summary(p1 <- powerTransform(cycles ~ len + amp + load, Wool))
# fit linear model with transformed response:
coef(p1, round=TRUE)
summary(m1 <- lm(bcPower(cycles, p1$roundlam) ~ len + amp + load, Wool))

Is it sensible to apply Box-Cox method to just the dependent variable (and not the whole formula) and proceed with the regression:

library(fifer)
cycles = boxcoxR(cycles)
summary(m1 <- lm(cycles ~ len + amp + load, Wool))

I suspect this method is not right but I am not sure.
rnso
  • 8,893
  • 14
  • 50
  • 94
  • Always helpful to mention the language you are using, here R. – Nick Cox May 05 '15 at 18:16
  • 1
    It is possible, of course (if it is sensible is another question). The function `powerTransform` from the `car` package accepts a single vector. So you could use `p1 – COOLSerdash May 05 '15 at 18:43
  • The explicit purpose of the Box-Cox transformation is to transform the dependent varIable thus de-linking the variance of the model's errors with the expected value of Y. In my opinion it was never intended to be applied to predictor series. – IrishStat May 06 '15 at 00:01
  • 1
    @Irish Another explicit purpose of this family of transformations is to help linearize relationships. At least [Tukey claimed as much.](http://stats.stackexchange.com/a/35717/919) Plausibly, it could be used with predictor series for that purpose. – whuber May 06 '15 at 00:14
  • By mistake I had kept bcpower in second set of statements also. I have corrected it now. – rnso May 06 '15 at 00:16
  • @whuber Apparently so but I am not sure why any individual X or all X's would need a transformation that was based primarily on the linkage between the expected value of Y and the model's error variance see http://stats.stackexchange.com/questions/74537/log-or-square-root-transformation-for-arima/74695#74695 and Aksakal's wise reflections here. – IrishStat May 06 '15 at 00:31
  • 1
    @IrishStat While Box and Cox (1964) does largely focus on transformation of DVs, this would be expected, since (as Box&Cox mentions) Box and Tidwell (1962) address transformation of IVs. In addition, section 8 of Box&Cox does discuss simultaneous transformation of both y and the x's. So while the prime focus of the Box&Cox paper itself is on tranformation of IVs I think it's too strong to state it was never intended to relate to independent variables. If we then add Tukey's work on simultaneous transformations of both (where he also includes log as the '0th power'), ...(ctd) – Glen_b May 06 '15 at 00:57
  • (ctd)... between Box&Tidwell, Box&Cox and Tukey (and some others) we have plenty of basis for considering transformations of both IVs and DVs. It's not so surprising that many implementations of such transformations parameterize transformations in both in the form $(z^\lambda-1)/\lambda$, and so use "Box-Cox" as a catch-all for transformations of both. – Glen_b May 06 '15 at 00:57
  • @Glen_b Unwarranted transformations can be like bad drugs and should be studiously avoided but I certainly see the point that you are making. . – IrishStat May 06 '15 at 01:17
  • 1
    @IrishStat I don't dispute your evaluation of it; they're frequently overused and like any model selection process there are biases introduced by trying to optimize them. In general transformations, if used at all, should be based on sounder ground (theoretical considerations, for example); if that's unavoidable, the impact of the selection process on inference needs to be properly accounted for. – Glen_b May 06 '15 at 01:28
  • 1
    It is interesting that the original Box and Cox paper had two examples in which the eventual choices were logging and taking reciprocals respectively, both of which would have been evident to experienced analysts independently of the Box-Cox machinery.. I think that is the way to use it, **as suggestive**; taking the estimated power too literally and using e.g. 0.123 or -0.456 often leads to models that are hard to interpret and fits that can't be reproduced on similar data. (I set aside fitting power laws $y = ax^b$ where taking logarithms is usually natural as a way to estimate parameters.) – Nick Cox May 06 '15 at 07:40
  • Agree with @NickCox last comment. I often considered Box-Cox, but always ended up not using it, e.g. applying log-transform. This could be the specificity of my models though. We deal with asset prices which tend to be exponentially growing or GBM processes in most cases. – Aksakal May 06 '15 at 17:29
  • The brilliance of Box-Cox I think does include (1) the very natural idea that the data themselves can tell you what transformation is indicated (2) the unification of transformations as a family (3) a unifying likelihood approach. On (2) it's bizarre that Tukey's previous paper in _Annals of Mathematical Statistics_ 1957 is not cited, but Box and Cox is not rich in references. Disclaimer: Sir David Cox and I are not related. – Nick Cox May 06 '15 at 17:42

1 Answers1

3

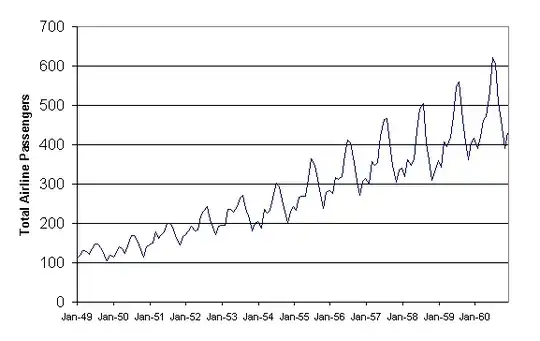
It depends on your process. For instance, your independent variables are stationary, but your dependent variable is not. You observe that it's variance seems to increase with the level. In this case it's appropriate to apply Box-Cox to the dependent variable only.

The point is that you use this particular transformation to solve certain issue such as as heteroscedasticity of certain kind, and if this issue is not present in other variables then do not apply the transformation to them.

UPDATE: Here's the typical example when Box-Cox is prescribed, it's from this page. You see how the variable seems to swing wider when the level grows. Personally, I would consider an exponential growth with multiplicative errors, but this is a classic example for Box-Cox. enter image description here

Aksakal
  • 55,939
  • 5
  • 90
  • 176
  • Whether or not the variance of Y increases/changes with level is not the issue. That kind of non-stationarity or Gaussian violation can often be more easily treated with Intervention Detection schemes. Box-Cox tests ( is a remedy) for the linkage between the expected value of Y and the models error variance ... nothing to do with the variance of Y or X – IrishStat May 06 '15 at 00:39
  • @IrishStat The model errors are not observable. It's convenient to talk about them as if we knew them, of course, but the reality's that we don't know them. What you observe is Y and X. When your Y looks like swinging more at higher levels than at lower levels you consider applying Box-Cox. – Aksakal May 06 '15 at 00:59
  • http://www.autobox.com/cms/index.php/news/54-data-cleansing-and-automatic-procedures presents a counter example ( start with slide 14 ) where there is larger/ higher variability of Y for higher levels of Y BUT this goes away when you model Y taking into account a few pulses/unusual values. To reiterate the Box_cox test evaluates the dependency/linkage between Y and the error variance. It has nothing to do with the actual variablility of Y itself. – IrishStat May 06 '15 at 01:12
  • @Irish I cannot recognize the data in your analysis beginning at p. 14. In particular, your plot of annual SD vs. annual mean on p. 15 doesn't look remotely consistent with the data shown on the preceding page. (The plot you describe on p. 15, as I understand it, can be produced in `R` with the commands `x – whuber May 06 '15 at 17:25
  • @wuber thanks for picking up on this. The plot (inadvertently) shows the relationship between the standard deviation of the transformed data versus the mean of the observed values. If one simply plots the annual standard deviation and the annual mean in the observed metric there is visual linkage. We will fix this. Trust but Verify ! – IrishStat May 06 '15 at 21:10
  • @wuber after reviewing the results ... if you filter the Y variable by double differencing (1-B**1)(1-B**12) you get a vector or residuals. The annual standard deviations of those residuals is then plotted versus the annual means of the observed series. This plot suggests that the standard deviations are not linked to the observed means and that there is only one year ( the last) one where the standard deviation is high relative to the mean causing a spurious correlation between them. – IrishStat May 08 '15 at 05:31