I created a spreadlevel plot on my simple linear regression model in R. Here is my code,
spreadLevelPlot(ols_reg)
where ols_reg is my regression model, ols_reg <- lm(y~0+.,dat). I first encountered spread-level plots from this link, but I don't fully understand how to read the plot and what to do with the transformation this function provides. Suggested power transformation: 0.718
This is how my plot looks,
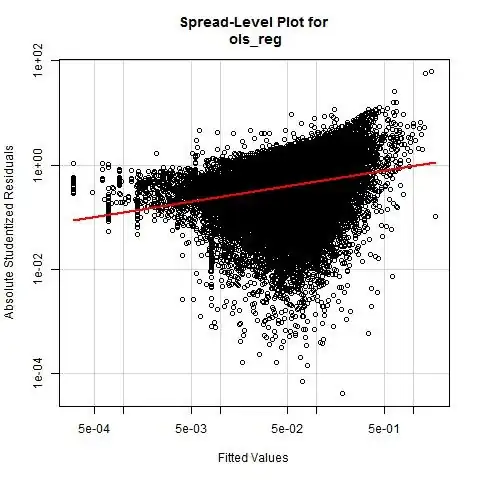
How do I read it?
These are the libraries I included in my script.
library(car)
library(MASS)
library(lmtest)