4

I have a data set that contains outliers (big orders) i need to forecast this series taking the outliers into consideration. I already know what the top 11 big orders are so i dont need to detect them first. I have tried a few ways to deal with this 1) forecast the data 10 times each time replacing the biggest outlier with the next biggest until the last set is run with them all replaced and then compare results 2) forecast the data another 10 times removing the outliers in each until they are all removed in the last set. Both of these work but they dont consistently give accurate forecasts. I was wondering if anyone knew another way to approach this?

One way i was thinking was running a weighted ARIMA and work it so that less/minimal weight is put on those specific data points. Is this possible?

I just want to point out that removing the known outliers does not delete that point completely, only minimizes it as there are other deals that happened in that quarter

One of my data sets is the following:

data <- matrix(c("08Q1",    "08Q2", "08Q3", "08Q4", "09Q1", "09Q2", "09Q3", "09Q4", "10Q1", "10Q2", "10Q3", "10Q4", "11Q1", "11Q2", "11Q3", "11Q4", "12Q1", "12Q2", "12Q3", "12Q4", "13Q1", "13Q2", "13Q3", "13Q4", "14Q1", "14Q2", "14Q3", "14Q4",155782698,   159463653.4,    172741125.6,    204547180,  126049319.8,    138648461.5,    135678842.1,    242568446.1,    177019289.3,    200397120.6,    182516217.1,    306143365.6,    222890269.2,    239062450.2,    229124263.2,    370575382.9,    257757410.5,    256125841.6,    231879306.6,    419580274,  268211059,  276378232.1,    261739468.7,    429127062.8,    254776725.6,    329429882.8,    264012891.6,    496745973.9),ncol=2,byrow=FALSE)

the known outliers in this series are:

outliers <- matrix(c("14Q4","14Q2","12Q1","13Q1","14Q2","11Q1","11Q4","14Q2","13Q4","14Q4","13Q1",20193525.68,18319234.7,12896323.62,12718744.01,12353002.09,11936190.13,11356476.28,11351192.31,10101527.85,9723641.25,9643214.018),ncol=2,byrow=FALSE)

please do not say about seasonality as this is only one type of data set, i have many ones without seaonality and i need the code to work for both types.

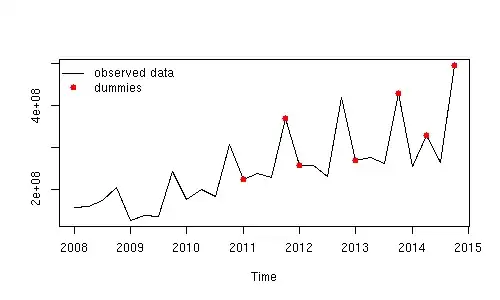
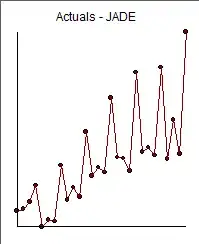
Edit by javlacalle: This is a plot of the observed data and the time points defined in the first column of outliers.

original data and outliers

javlacalle
  • 11,184
  • 27
  • 53
  • What are the values in the second column of the matrix `outliers`? Why are the points "13Q1", "14Q2" and "14Q4" duplicated in the first column of this matrix? The series does not seem to have as many outliers as you detected. Maybe you are interested in forecasting a smooth pattern of the series? – javlacalle Apr 27 '15 at 18:39
  • they are repeated because these are the top 11 bookings in the series. they are considered outliers because they may not happen again in this pattern. they may not all be outliers but i would like to find a way to tell and then deal with the series. I have already triend running the series 10 times each time replacing the biggest order with the next biggest order and then comparing the results to find a point the forecasts level out. but this isnt as accurate as i would like – Summer-Jade Gleek'away Apr 28 '15 at 07:59
  • In the question you say that `outliers` are _known outliers_ but in the comment above you say _they may not all be outliers_. Do you or don't you know the outliers? If you know them (they may be some exceptional events that you observed in the history of the data), then you could fit an ARIMA model with dummies for those points. If you don't know them, then you could do an analysis in the lines of the answer given by Irishstat. If any of these situations fits your purposes, I could give you some guidance about how to do it in R. – javlacalle Apr 28 '15 at 08:46
  • im saying that they arent exactly 'outliers' but just big orders that arent definitly going to happen again. but whether all the 11 i gave are affecting the series or not isnt clear either. I know that these are the only ones that can be outliers. Where commands in R that detect outliers dont select these ones – Summer-Jade Gleek'away Apr 28 '15 at 08:52
  • I have edited you question with the plot of the data and the outliers that you mention. Is that a correct interpretation of your data? If so, what about fitting an ARIMA model with dummies for the points in red? Or are you interested in selecting an ARIMA model and detecting outliers as done in the answer given by Irishstat? – javlacalle Apr 28 '15 at 09:13
  • 2
    Plotting your data on logarithmic scale makes the supposed outliers even less convincing. For whatever reason, you have peaks every 4th quarter. So you have trend, seasonality, some irregularity. That's par for the course, and nothing pathological. Even @IrishStat's analysis, which often produces models more complicated than would suit many other researchers, comes close to saying that. – Nick Cox Apr 28 '15 at 09:34
  • @javlacalle it is correct, however keep in mind that the whole data point isnt an outlier itself, only some bookings within that quarter are – Summer-Jade Gleek'away Apr 28 '15 at 09:42
  • @NickCox i know that here it shows seasonality as it is the total business but in other, smaller, data sets there is no seasonality at all – Summer-Jade Gleek'away Apr 28 '15 at 09:44
  • Indeed: other datasets you don't show us may not behave similarly, but if they pose problems you should ask separate threads. Your point to @Javlacalle doesn't really mention a problem. It's on all fours with saying that my food consumption during a day is dominated by three outliers, namely meals. If I have daily data, that's correct but immaterial. If you aggregate over any time scale, then fine structure within those intervals does not enter into an analysis. – Nick Cox Apr 28 '15 at 10:12
  • I have edited the question with some R code that applies one of the ideas that I mentioned. I wouldn't treat this data set this way. I think it is more appropriate an analysis in the lines given by Irishstat. But as you insist in somehow dealing with those particular observations, maybe trying this code helps you clarifying your question. – javlacalle Apr 28 '15 at 11:16
  • 2
    Further, your request not to mention seasonality misses the point that the "outliers" in this example are interpretable largely as a reflection of seasonality. That is, seasonality really is germane. – Nick Cox Apr 28 '15 at 11:16
  • @NickCox I just tried to give some ideas to the original poster to clarify the question. I still don't understand the question, why the OP insists in treating those observations as outliers and ignoring seasonality, so I am not in a position to give an answer. – javlacalle Apr 28 '15 at 11:22
  • 1
    A simple solution, why don't you simply subtract those big orders from your data and run the forecast model? – forecaster Apr 28 '15 at 16:50
  • As suggested by @NickCox, I have removed some content from my previous edit and have included it as part of my answer below. – javlacalle Apr 28 '15 at 16:57
  • if you're sure these are outliers, then remove them. It seems that you're not so sure after all. – Aksakal Apr 28 '15 at 17:25
  • @NickCox there may be seasonlity with these big order, but in other data sets there isnt. i need something that i can use for all sorts of data as it needs to be automatic and frequent, there isnt time to adapt the code for each type of data – Summer-Jade Gleek'away Apr 30 '15 at 11:08
  • @forecaster i have tried that already but the forecast isnt close to the actual amount. i need other methods – Summer-Jade Gleek'away Apr 30 '15 at 11:09
  • @Aksakal i am not positive that ALL of those are outliers, they may or may not affect the outcome but as it isnt a transactional data set then the income in each quarter isnt constant as its all down to sales. they might not be a large sale for a few quarters and then there is a huge one or there may be 3 large in a row. so i need something that can work around these large deals and give an amount that will be aimed towards if no large deals happen...does that make sense? – Summer-Jade Gleek'away Apr 30 '15 at 11:15
  • 1
    I respect your practical constraints, but it is no longer clear what the question is. Your question as posted above concerns a specific dataset, but your comments downplay that dataset entirely and ask for a much more general strategy, roughly: I may have outliers; I may have seasonality; I want a general robust method for forecasting. The thread seems in permanent tension between your posing a very specific question and your seemingly wanting a much more general answer. – Nick Cox Apr 30 '15 at 11:29

3 Answers3

7

The OP insists in dealing with the points that are reported in the question as outliers without considering them as part of a possible seasonal pattern. Below I first give an idea to treat these points separately. In the second part of the answer I propose an alternative approach in the lines of the answer given by @Irishstat, which is a more appropriate analysis of the data.

The effect of these observations can be weighted by means of regression on seasonal dummies (variables that take the value 1 at the time points related to the outliers and 0 otherwise). Then, an ARIMA model for the residuals of the regression could be fitted and used to obtain forecasts.

It may be more efficient to estimate jointly the coefficients for the dummies and those of the ARIMA model, but I did not get a satisfactory result so I decided to split it in two steps as show below.

require(forecast)
x <- ts(as.numeric(data[,2]), frequency = 4, start = c(2008, 1))
outliers <- c(2011.00, 2011.75, 2012.00, 2013.00, 2013.75, 2014.25, 2014.75)
# create dummies
dummies <- matrix(0, nrow = length(x), ncol = length(outliers)) 
for (i in seq_along(outliers))
  dummies[which(time(x) == outliers[i]),i] <- 1
# estimate the weights for these dummies and store the residuals
fitaux <- lm(x ~ dummies)
resid <- residuals(fitaux)
# fit an ARIMA model to the residuals and display forecasts
fit <- auto.arima(resid, ic = "bic")
fcast <- forecast(fit, 8)
# full code of the plot shown below is not posted to save space
plot(fcast)

forecasts of first approach

There is high uncertainty in the forecasts (wide lower and upper bounds). Although not shown, the residuals do not show autocorrelation but there is some sign of overdifferencing. The choice of the ARIMA model should be explored further, but I think this gives you the idea.


As mentioned in the comments above, I don't think the above approach is appropriate. I would do and analysis in the lines of the answer given by Irishstat. The R package tsoutliers follows the approach proposed in Chen and Liu (1993) to detect outliers in time series (e.g. additive outlies, level shifts). This is what I get:

require(tsoutliers)
fit2 <- tso(x, args.tsmethod=list(ic="bic"))
fit2
# ARIMA(0,0,0)(0,1,0)[4] with drift         
# Coefficients:
#         drift        LS4
#       8810020  -64443697
# s.e.  1289215   14293608
# sigma^2 estimated as 5.529e+14:  log likelihood=-366.02
# AIC=738.04   AICc=739.24   BIC=741.57
# Outliers:
#   type ind    time   coefhat  tstat
# 1   LS   4 2008:04 -64443697 -4.509
#
# type plot(fit2) to see the shape of the detected outlier(s)
#
# refit the model with the series adjusted for outliers
# (this will save arrangements to display forecasts
# the same model as in fit2$fit is chosen
fit2 <- auto.arima(fit2$yadj, ic="bic")
plot(forecast(fit2, 8))

forecasts based on second approach

The series is relatively clean from outliers. None of the outliers initially proposed in the question were detected. Similarly to the results shown by Irishstat, the forecasts look now more reliable, since they reflect the overall dynamics of the data.

javlacalle
  • 11,184
  • 27
  • 53
4

If you start with a bad/insufficient model then one can incorrectly find many outliers. A good model will capture systematic patterns in the data and good diagnostic analysis can suggest periods in time where the model was inadequate suggesting required enhancements. Your 28 quarterly values graphed here enter image description here suggest the following model including two outlier adjustments enter image description here 
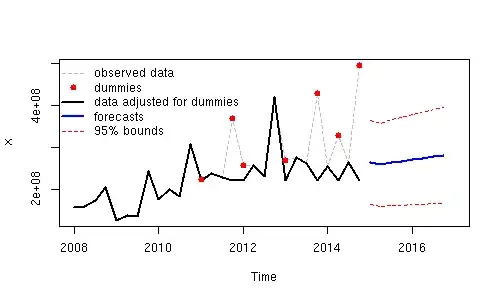
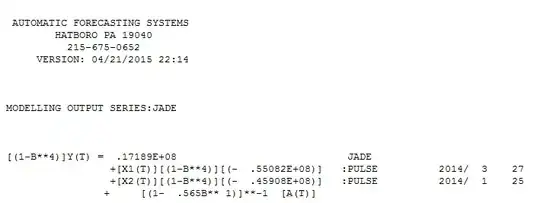
The two outliers (low values) can be seen here in the actual/cleansed plot enter image description here 
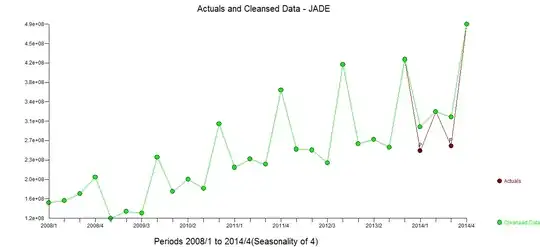
. The model generated the following residuals enter image description here 
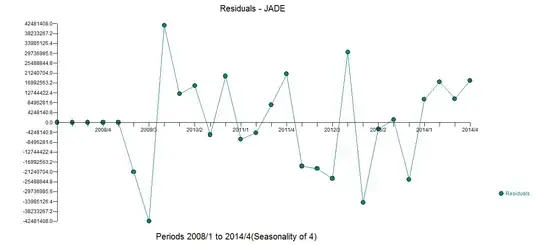
which are free of any apparent auto-correlative structure enter image description here 
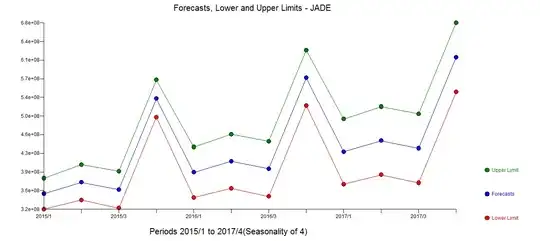
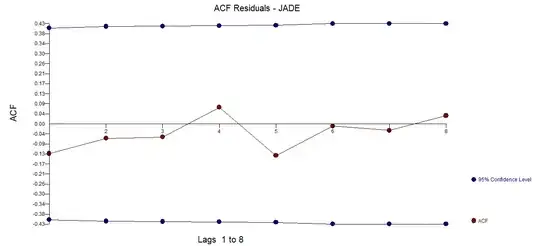
. The forecasts reflect the adjustment for the two anomalies enter image description here

IrishStat
  • 27,906
  • 5
  • 29
  • 55
  • Thankyou for your response. I am unsure of how to do this in R though. – Summer-Jade Gleek'away Apr 27 '15 at 07:59
  • @Summer-JadeGleek'away I suggest you look at IrishStat's user page and visit the website mentioned therein. He is probably using software called Autobox. That would be a place to start. Reproducing results in R might take a lot of study. – Mark Miller Apr 27 '15 at 21:47
  • @Summer-JadeGleek'away See also here: http://stats.stackexchange.com/questions/32742/auto-arima-vs-autobox-do-they-differ – Mark Miller Apr 27 '15 at 22:07
  • 1
    The downvote here seems unfair and I've reversed it. Not using R is not good grounds for a downvote and that is the only negative comment made. – Nick Cox Apr 28 '15 at 11:18
  • @NickCox I did not downvote, but I would prefer to know the name of the procedure used and/or a citation for the procedure. – Mark Miller Apr 28 '15 at 13:10
  • @http://stats.stackexchange.com/users/9355/mark-miller The best reference for the procedure is Tsay http://www.unc.edu/~jbhill/tsay.pdf which lays out how to identify anomalies ( time trends are not included here ) based upon a tentative ARIMA model. – IrishStat Apr 28 '15 at 13:14
  • +1 and I don't know why anyone would down vote this post. @IrishStat has taken time and effort to produce these results, I agree with Nick Cox that R is not prerequisite for answering these type of questions. – forecaster Apr 28 '15 at 16:55
  • @forecaster I think you forgot upvoting this answer. – javlacalle Apr 28 '15 at 17:10
0

To me it's essentially the choice between pushing the uncertainty of "big" shocks to the forecasts or to remove them from the forecast. For instance, you could identify the outliers and put dummies in those dates. Then your dummies will catch the uncertainty, and since you don't forecast dummies, these uncertainties will be trapped in the dummies. You seem to expect that big sales may happen in the future, but in the approach with outliers your forecast will not reflect this possibility.

The second option is to leave the outliers in. In this case your error variance will increase, to the extent the big shocks are not correlated with your explanatory variables. Hence, when you forecast your confidence bands will widen reflecting the uncertainty you couldn't capture in your explanatory variables. After all you're not sure if the big shock would pop up at any time in future. the issue with this approach is that outliers often introduce bias in estimates, so it's not a clean packaging of uncertainty into the error term.

Whether you go with one option or another is a matter of preference and circumstances.

Aksakal
  • 55,939
  • 5
  • 90
  • 176