I have a data.frame with two columns (x and y) for which I have obtained a nonlinear least squares fit: -a/(b+exp(-x)).
Now I'm trying to plot the 95% confidence interval for y. My best attempt so far is based on another nonlinear fit of the standard error of y for several intervals of x: a*x^-b. This first fit +/- 1.96 the second fit are plotted below. 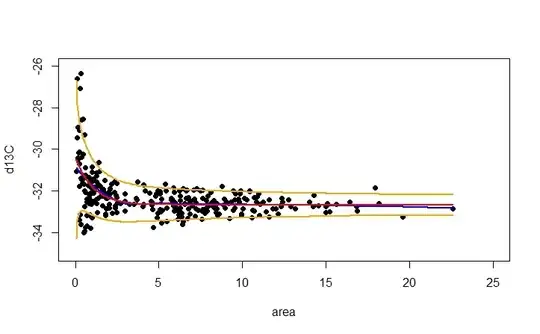
This seems a bit arbitrary though, so I am wondering if there is a more robust way of calculating this confidence interval? I've been exploring the bootstrap, but so far I've only been able to obtain values and I'm unsure about how to transform them into an interval which is clearly dependent on the x-value. What should I do with the values resulting from boot.ci? Or should I, if possible, bootstrap both x and y at the same time?
Let me know if I should provide more details.