7

enter image description here

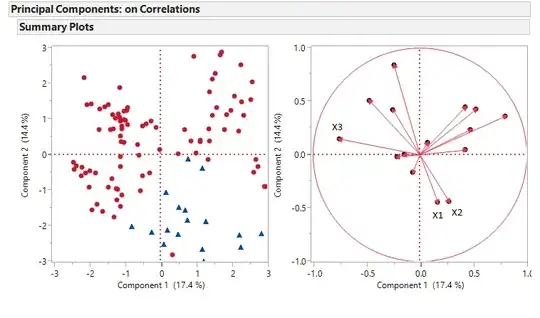
Blue points all appear in the lower right-hand quadrant in the plane formed by the first two principal components.

Is it a good interpretation of the biplot (right panel) to say that blue points are mainly characterized by large values of X1 and X2 and small values of X3?

user7064
  • 1,685
  • 5
  • 23
  • 39
  • What do the points on the right plot represent? What are your loadings – Taylor Apr 22 '15 at 05:49
  • The points on the right represent the variables used to construct the principal components. – user7064 Apr 22 '15 at 05:55
  • So a point for each column/predictor? Then yeah – Taylor Apr 22 '15 at 05:59
  • 1
    Yes, your interpretation seems to be correct. – rnso Apr 22 '15 at 06:45
  • Did you search this site for `PCA biplot`? – ttnphns Apr 22 '15 at 06:48
  • @ttnphns: Yes, of course... but I wanted to be sure my interpretation is correct for this particular example where there seems to be a clear discrimination between blue and red in the plane formed by the first two PC's. – user7064 Apr 22 '15 at 06:50
  • 3
    `to say that blue points are mainly characterized by large values of X1 and X2 and small values of X3` Roughly saying, yes. When it comes to precise treatments of the distances on the plot much depends on the normalizations applied. If I find time today later I will perhaps write an answer. – ttnphns Apr 22 '15 at 07:15
  • @ttnphns: Would be great :-) Thanks in advance! – user7064 Apr 22 '15 at 07:17
  • @ttnphns: Didn't you have time since 2015 to explain more? :) I also have the same question and want to know how to map the left figure to the right? Or better saying, what information does the right figure tells in order to better understand the left figure? – mahmood Dec 21 '20 at 15:35
  • Search the site for PCA loading plot, please. Hopefully you will understand. – ttnphns Dec 21 '20 at 16:13

0 Answers0