62

Anybody have any experience with software (preferably free, preferably open source) that will take an image of data plotted on cartesian coordinates (a standard, everyday plot) and extract the coordinates of the points plotted on the graph?

Essentially, this is a data-mining problem and a reverse data-visualization problem.

Alex Holcombe
  • 519
  • 1
  • 7
  • 9
  • 2
    For one solution, see the comments to [this reply](http://stats.stackexchange.com/questions/14351/forecasting-time-series-based-on-a-behavior-of-other-one/14366#14366). Open source solutions would include image processing or raster GIS software ([GRASS](http://grass.fbk.eu/) is a likely candidate) or, perhaps, [GNU Octave](http://www.gnu.org/software/octave/). I'm mentioning these as a comment because I haven't used either for this specific purpose, so please take them as possibilities, not as definite solutions. – whuber Aug 18 '11 at 04:20
  • I'm hoping for code/software specifically for scraping graphs, and I remember such packages existed, at least they did 10 yrs ago, but I can't remember their names now, and don't know if they work on current operating systems. – Alex Holcombe Aug 18 '11 at 04:56
  • @Alex, try googling ["Graph Digitizer Open Source"](http://www.google.com/search?sourceid=chrome&ie=UTF-8&q=graph+digitizer+open+source) – David LeBauer Aug 18 '11 at 05:52
  • A short Mathematica program to get data from scans [here](http://mathematica.stackexchange.com/a/3843/57). – Sjoerd C. de Vries Jun 06 '15 at 14:29
  • Is it actually publishable after you extracted the data from a graph? If I extracted a data from one publication, can I actually use it for my analysis. I wonder about this for a long time. Thanks. –  Jul 24 '15 at 19:23
  • 1
    See also the resource I point to in my answer to [What is the relationship between *Y* and *X* in this plot?](https://stats.stackexchange.com/questions/114610/what-is-the-relationship-between-y-and-x-in-this-plot/114628#114628). – Alexis Oct 30 '17 at 19:59
  • You can google [PlotDigitizer.com](https://www.google.com/search?&q=plotdigitizer.com). It has a [free online app](https://plotdigitizer.com/app) that can scrape data from graphs – Anonymous Jan 15 '21 at 09:23

12 Answers12

45

graph digitizing software

There are many different options, but all basically use the same workflow:

  1. upload an image
  2. set the x and y scales by indicating the values at two points on each axis
  3. indicate if the scale is linear, log, etc,
  4. click on the points.
    • Some of the programs automatically recognize lines or points. I am usually after points, and I find them too inconsistent to be helpful even with 100s of points. I have not found one that recognizes different symbols. This feature could be worth the trouble for digitizing lines, but I have never had to do this.

The program returns each point as an x-y matrix.

Often it helps selecting points if the image is zoomed, either by uploading a zoomed version of the image or using the zooming feature available in some of the programs.

There are many programs, and they vary in extra features, usability, licensing, and cost. I have listed them below.

All of the ones I have used work fine. Except in contexts where measurement error is very small, error from graph scraping is insignificant (e.g. error from digitization << size of error bars or uncertainty in the estimate). If have not tested the accuracy of any of these programs, but it would be interesting to compare among users, among programs, and against the results of reproduced statistical analyses.

Programs I have used:

  • Digitizer (free software, GPL) auto point / line recognition. Available in Ubuntu repository (engauge-digitizer)
  • Get Data (shareware) has zoom window, auto point / line recognition
  • DigitizeIt (shareware) auto point / line recognition
  • ImageJ (open source, most extensible after R digitize)
  • R digitize (free, open source), because it simplifies the processs of getting data from the graph into an analysis by keeping all of the steps in R. See the tutorial in R-Journal
  • GrabIt! (free demo, $69) Excel plug-in
  • WebPlotDigitzer (free, online). Browser based, extracts data from images. Reviewed here.

Programs I have not used:

  • GraphClick (Mac, $8)
  • g3data (open source - GNU GPL) Has zoom window, no auto-recognition. Available in Ubuntu repository.
  • GRABIT OpenSource (BSD) plugin that runs in a proprietary platform, Matlab

TL;DR: WebPlotDigitizer is available as a web application as well as a chrome plugin

Kodiologist
  • 19,063
  • 2
  • 36
  • 68
David LeBauer
  • 7,060
  • 6
  • 44
  • 89
  • [g3data](http://www.frantz.fi/software/g3data.php) (open source - GNU GPL) has zoom window, no auto-recognition. Available in Ubuntu repository. I can't compare, as it's the only one I've tried; but I found it very easy to use. – Scortchi - Reinstate Monica Oct 16 '13 at 22:54
  • Why R digitize was removed from CRAN? – Léo Léopold Hertz 준영 May 05 '16 at 08:47
  • It would be great to have here which work with images and which with .eps in pdf files. For instance, `g3data` does not work with pdf files. – Léo Léopold Hertz 준영 May 05 '16 at 08:54
  • 1
    @Masi most of these don't work with pdf, with pdf files I make the figure large and then use a screen capture (eg cmd-shift-4 on Mac) to save a figure as jpg or png. – David LeBauer May 07 '16 at 02:03
  • 1
    @Masi Maintaining a package on CRAN can be a lot of additional work. The package is available on GitHub https://github.com/tpoisot/digitize – David LeBauer May 07 '16 at 02:10
  • @DavidLeBauer I describe here how I do the extraction of rasterized image from a pdf file http://unix.stackexchange.com/q/281211/16920 However, still, I cannot do it for a vectorised format systematically. How well does the package do with points which have intersections of the axis? Or with a continuous graph which have intersections with axes? – Léo Léopold Hertz 준영 May 07 '16 at 05:16
  • 1
    @Masi what specifically do you mean by 'systematically'? Can you link to the figure(s) in question? When you say 'intersect', do you mean the point is contained within the axis and thus does not appear? – David LeBauer May 08 '16 at 03:08
  • @DavidLeBauer Please, see the example image here http://unix.stackexchange.com/q/281211/16920 where the graph intersections with x-axis. In this case, there are many data points presented by a continuous graph. I also provided point intersection with the axes as an example there. Systematically - a function to do the processes. – Léo Léopold Hertz 준영 May 08 '16 at 06:47
  • great answer. Any comment on tools to extract data from 3-D figures. – Amir Apr 18 '17 at 22:17
  • @amir do you mean a 3-D figure projected to 2-D? Off the top of my head that seems like a very difficult problem that would depend on how the third dimension is represented. Do you have an example? – David LeBauer Apr 21 '17 at 15:21
  • @DavidLeBauer here is some 3-D plots. but also my main reason I ended up with this question. My goal is to see if there is any format that can remove all this "extraction" and journals can ask for that if people are serious about "publishing" or "peer review".https://academia.stackexchange.com/questions/87380/is-there-any-standardization-of-figures-for-scientific-publication-in-any-field – Amir Apr 23 '17 at 05:29
  • You listed all tools but missed one: [Plotdigitizer.com](https://plotdigitizer.com/) – Anonymous Dec 21 '20 at 12:11
40

Check out the digitize package for R. Its designed to solve exactly this sort of problem.

luchonacho
  • 2,568
  • 3
  • 21
  • 38
Zach
  • 22,308
  • 18
  • 114
  • 158
17

Other answerers assume that you deal with raster image of a graph. But nowadays the good practice is to publish graphs in vector form. In this case you can achieve much higher exactness of the recovered data and even estimate the recovery error if you work with the code of the vector graph directly, without converting it to raster image.

Since the papers are published online as PDF files, I assume that you have a PDF file which contains vector plot with data you wish to recover from it (get in numerical form) and estimate introduced recovery error.

First of all, PDF is a vector format which is basically textual (can be read by a text editor). The problem is that it can (and almost always) contain compressed data streams which require to be uncompressed in order to read them by a text editor. These compressed data streams usually contain the information we need.

There are several ways to uncompress data streams in order to convert PDF file to a textual document with readable PDF code. Probably the simplest way is to use free QPDF utility with --stream-data=uncompress option:

qpdf infile.pdf --stream-data=uncompress -- outfile.pdf

Some other ways are described here and here.

The generated outfile.pdf can be opened by a text editor. Now you need PDF Reference Manual 1.7 to understand what you see. Do not panic at this moment! You need to know only few operators described in the "TABLE 4.9 Path construction operators" on pages 226 - 227. The most important operators are (the first column contains coordinate specification for an operator, the second contains the operator and the third is operator name):

x y               m   moveto 

x y               l   lineto 

x y width height  re  rectangle

                  h   closepath

In most cases it is sufficient to know these four operators for recovering the data.

Now you need to import the outfile.pdf file as text into some program where you can manipulate the data. I'll show how to do it with Mathematica.

Importing the file:

pdfCode = Import["outfile.pdf", "Text"];

Now I assume the simplest case: the graph contains a line which consists of many two-point segments. In this case each segment of the line is encoded like this:

268.79999 408.92975 m
272.39999 408.92975 l

Extracting all such segments from the PDF code:

lines = StringCases[pdfCode, 
   StartOfLine ~~ x1 : NumberString ~~ " " ~~ y1 : NumberString ~~ " m\n" ~~ 
                  x2 : NumberString ~~ " " ~~ y2 : NumberString ~~ " l\n" 
                                        :> ToExpression@{{x1, y1}, {x2, y2}}]; 

Visualizing them:

Graphics[{Line[lines]}]

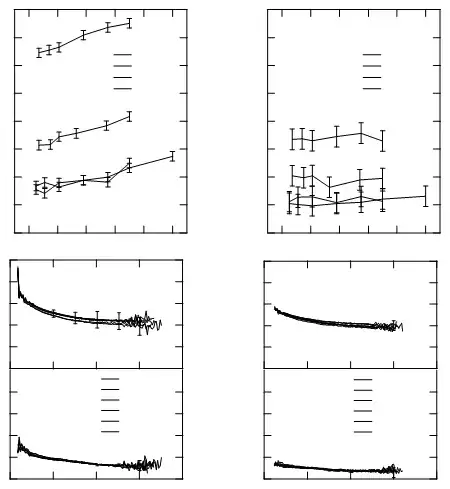
You get something like this (the paper I am working with contains four graphs):

plot

Each two adjacent segments share one point. So in this case you can turn the sequences of adjacent segments into paths:

paths = Split[lines, #1[[2]] == #2[[1]] &];

Now you can visualize all the paths separately:

Graphics[{Line /@ paths}]

From this figure you can select (by double-clicking) the path you are looking for, copy graphics selection and paste as new Graphics. For converting it backward to list of points you take the element {1, 1, 1}. Now we have the points not in the coordinate system of the graph but in the coordinate system of the PDF file. We need to establish relationship between them.

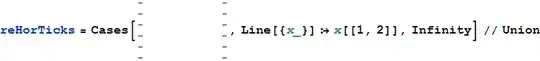
From the above plot you select ticks by hand (holding Shift for multiple selection), then copy them and paste as new Graphics. Here is how you can extract coordinates of horizontal ticks:

screenshot

Now check the differences between ticks:

Differences[reHorTicks]

From these differences you can see how precise is positioning of the ticks in the PDF file. It gives an estimate of error introduced by converting original datapoints into vector graph included in the PDF file. If there are appreciable errors in ticks positioning you can reduce the error by fitting the coordinates of ticks to a linear model. This linear function now can be used to get original coordinates of points of the path (that is in the coordinate system of the plot).

Alexey Popkov
  • 253
  • 3
  • 10
  • 2
    Alexey, you wrote **But nowadays the good practice is to publish graphs in vector form.** Do you have a good reference for best practices around *which* vector format(s)? (I.e. ought I use an eps encapsulation of an svg file in my LaTeX manuscripts, or am I supposed to output graph to LaTeX directly?) Cheers. – Alexis Sep 07 '14 at 17:49
  • 2
    @Alexis I refer to the modern journal's recommendations to provide graphs in vector form. Different journals accept different subsets of vector formats. In general I expect better quality when there are lesser transformations from one format to another. – Alexey Popkov Sep 08 '14 at 00:49
  • @Alexis So basically I expect that providing graphs in one of the PostScript formats (EPS or PDF) should be the best option. But exact answer depends on software used by the publisher. Note also that usually journals recommend against any conversions of the graphs produced by your graphing software. So if you can export as EPS it is probably the best option. If you can only export SVG then provide SVG if the journal accept it, do not convert yourself into other format. – Alexey Popkov Sep 08 '14 at 01:24
  • [Strongly related answer](http://mathematica.stackexchange.com/a/85329/280) with detailed description of the procedure for *Mathematica*. – Alexey Popkov Jun 06 '15 at 16:37
4

I haven't used it, but UWA CogSci lab recommend DataThief (shareware).

Jeromy Anglim
  • 42,044
  • 23
  • 146
  • 250
4

Check out engauge. Its free and open source http://digitizer.sourceforge.net/

ECII
  • 1,791
  • 2
  • 17
  • 25
3

Un-Scan-It http://www.silkscientific.com/graph-digitizer.htm

Harvey Motulsky
  • 14,903
  • 11
  • 51
  • 98
2

Try scanit: http://amsterchem.com/scanit.html

It is free of charge, runs on Windows

John
  • 1
  • 1
2

You can also try im2graph (http://www.im2graph.co.il) to convert graphs to data. Works in Linux and Windows.

2

'g3data' is a software which can be used to serve your purpose. It's a free software and I have used it. You can download it from here: http://www.frantz.fi/software/g3data.php

2

I had to do this so many times in my career I eventually put together a javascript program which is available here:

http://kdusling.github.io/projects/DataGrab/index.html

Sorry, but you will still need to click on every single point. Though you can use the arrow keys which does save some wrist strain.

1

STIPlotDigitizer has been newly released.

http://stiwww.com/product/software-techniques-plot-digitizer

1

For R users, the package grImport (on CRAN) can import vector graphics and convert them into objects that R can interpret. It assumes that one can convert PDF (or other vector format of interest) to PostScript format. This can be done for example with Inkscape: import (File > Import) your PDF page with your figure into Inkspace and File > Save As > Save as type: > PostScript *.ps. Once you have your *.ps file fallow the grImport vignette Importing Vector Graphics, more relevant being section '4.1. Scraping data from images'.

You will need ghostscript on your Operating System - try to download it from here.

Note, if you run somehow into ghostscript error 'status 127' when you call grImport::PostScriptTrace, then fallow the recommendation from here, which says to manually set the path to ghostscript on your machine.

Here is some sample R code to import PostScript file into R:

install.packages("grImport")
require(grImport)
# if you get the ghostscript error 'status 127' then set the path to ghostscript, e.g.:
Sys.setenv(R_GSCMD = normalizePath("C:/Program Files/gs/gs9.22/bin/gswin64c.exe")) 
PostScriptTrace(file = "graph.ps", outfilename = "graph.ps.xml")
my_fig <- readPicture(rgmlFile = "graph.ps.xml")
grid.picture(my_fig)

Note, if your graph is on a page in a multi page PDF file, then you can split the multi-page document with PDFTK builder. Import your one page PDF file in Ikscape and delete any extra elements (extra text, extra graph elements). This wil ease your work in R when trying to catch the coordinates of the graph elements you are interested in.

Valentin
  • 249
  • 1
  • 11