2

I'm new to Machine Learning. I have a question.

Given a Free Induction Decay graph, similar to the one shown below, how can I use Machine Learning to extract features (i.e., $f$, $f_0$, $V_{pp}$) from the graph? Should I use supervised or unsupervised learning? Is this a Classification or Regression problem? Can I use the Sci-Kit Learn Python Library or should I use MATLAB?

If anyone can help, that would be great.

enter image description here

BR56
  • 71
  • 6
  • This is an interesting type of problem because there are numerous plots in the literature that do not have enough explicit information, but may sometimes be extractable. That is important for reproducible science. – DifferentialPleiometry Jul 15 '21 at 15:47
  • There are not any units on your plot to calibrate against. It is not clear to me that there exists a unique parameter that would best-agree with the plot because of that. – DifferentialPleiometry Jul 15 '21 at 15:48
  • @Galen Well, this is really going backwards. The plot is generated from the features above. But can you extract the features from the plot? That's the question. – BR56 Jul 15 '21 at 16:02
  • I suspect you cannot in this instance because you do not have any reference of how much time we are looking at on the x-axis, nor the size of the signal on the y-axis. The shape of the curve alone is probably not enough. – DifferentialPleiometry Jul 15 '21 at 16:10
  • @Galen As for the units, the y-axis has no formal units (i.e., arbitrary units). It's just a measure of the contrast given by the signal or signal intensity $S(t)$. On the other hand, the x-axis is typically measured in microseconds $\mu s$. – BR56 Jul 15 '21 at 17:02
  • Is the task to input an image to a learning algorithm and extract the numerical data from the image itself? Like, in simpler terms, given a picture of a parabola, retrieve the coefficients? It seems like you'd have to do this in 2 stages: (1) collect the numerical/tabular data from the image (2) interpret the data as some parameterized function. We have a question about (1) here: https://stats.stackexchange.com/questions/14437/software-needed-to-scrape-data-from-graph as for (2), it seems to be ordinary NLS. – Sycorax Jul 15 '21 at 17:15
  • @Sycorax. Please may you clarify what you refer to when you mention NLS? I am unable to parse the acronym currently. – microhaus Jul 15 '21 at 17:22
  • 1
    nonlinear least squares – Sycorax Jul 15 '21 at 17:23
  • @Refath Ok, in which case you could use units such as pixel length in the first step that Sycorax describes. In order for the estimated parameters to be physically meaningful, I think you would need to determine the ratios of signal/pixel and/or time/pixel. – DifferentialPleiometry Jul 15 '21 at 17:35
  • @Galen OK, I'll look into it. – BR56 Jul 15 '21 at 17:38
  • @Galen Thanks everyone. I looked into it and got some interesting results using SciPy's `curve_fit()`. Now I have a different question: **what type of Machine Learning model should I use to _classify_ different types of graphs** (i.e., sinouisdal, exponential, etc.)? – BR56 Jul 18 '21 at 20:22
  • @Refath Congratulations on working out a solution. Please feel free to post what worked as an answer below. – DifferentialPleiometry Jul 18 '21 at 21:12
  • @Refath One question per post please. – DifferentialPleiometry Jul 18 '21 at 21:13
  • Hi @Galen, thanks for the suggestion. I opened a new question. I'm also adding my answer to this question. – BR56 Jul 18 '21 at 21:14

1 Answers1

2

Here are the 3 steps I used to extract parameters from an FID. Note that this is only what I could come up with in a short amount of time, so others may have better solutions.

Notes:

  • Every once in a while, SciPy seems to fall in a "false minimum" problem, where it believes it has found the curve of best fit, but really hasn't. I'm not sure why this happens or how to fix it.
  • Yes, I am extracting only a finite amount of points from the FID, in this case from the domain (-9,10). Of course, this can be expanded.

Step 1: Create a Random Damped Oscillator

A damped oscillator is analogous to an FID. The inputs = [], outputs = [] arrays serve to store discrete values from the graph. These arrays will later be converted into a pandas pd.DataFrame, which will be the input for the regression network. Use numpy.rand() to generate random values for A, w, T2. Then use a for loop to add values to the inputs = [], outputs = [] arrays.

inputs = [], outputs = []

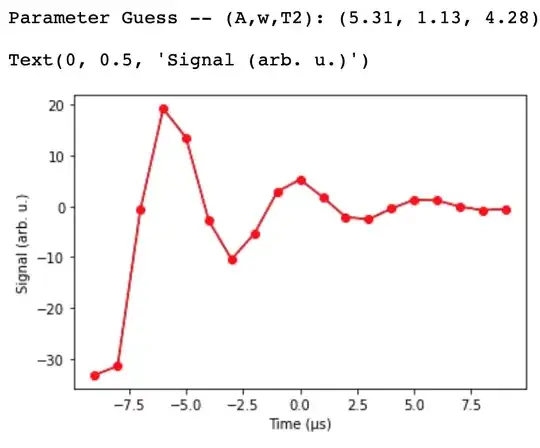
y = A*np.cos(w*dom)*(2.718**(-dom/T2))

def expDec(t, A, w, T2):
    return A*np.cos(w*t)*(2.718**(-t/T2))

for i in range(-9, 10): 
    inputs.append(i)
    outputs.append(expDec(i, A, w, T2))

Step 2: Create DataFrame

Create a pandas pd.DataFrame. This seemed the best way to "hand-over" the graph's values.

points = {'Input': inputs, 'Output': outputs}
x = pd.DataFrame(points, columns = ['Input', 'Output'])

Step 3: Best-Fit Curve

There's a few parts to this. First, explicitly inform the program what type of graph you want to be extracting the parameters from. In our case, it's an FID, analogous to a Damped Oscillator. Then, retreive the values from the graph and store them in the ins, outs variables. Pass these variables onto SciPy's curve_fit function. This function will return what SciPy believes are the best parameters that fit the FID. Now pass on these parameters to realFunc(), which will append all the output values in the domain (-9,10) to the fit=[] array.

def realFunc(t, A, w, T2):
    return A*np.cos(w*t)*(2.718**(-t/T2))

ins = x['Input'].values
outs = x['Output'].values
fit = []

constants = curve_fit(realFunc, ins, outs, maxfev=1000)

for i in range(-9,10):
    fit.append(realFunc(i, A_fit, w_fit, T2_fit))

plt.plot(x['Input'], x['Output'])
plt.plot(x['Input'], fit,"ro-")

enter image description here

And that's it! All of these steps can be followed at the Interactive Jupyter Notebook found here.

BR56
  • 71
  • 6