I want to calculate a p-value to reject H0 at significance level α iff
p<α; proving that my population is normally distributed.
The normal distribution arises when the data is generated by a series of additive iid events (see the quincunx image below). That means no feedbacks and no correlations, does that sound like the process that lead your data? If not, it is probably not normal.
There is the off chance that type of process may be occurring in your case. The closest you can come to "proving" it is to collect enough data to rule out any other distributions that people can come up with (which is probably not practical). Another way is to deduce the normal distribution from some theory along with some other predictions. If the data is consistent with all of them and no one can think of another explanation then that would be good evidence in favor of the normal distribution.
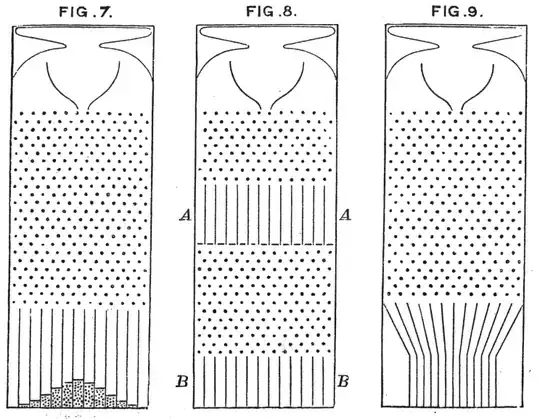 https://en.wikipedia.org/wiki/Bean_machine
Now if you do not expect any specific distribution a priori it may still be reasonable to use the normal distribution to summarize the data, but recognize that this is essentially a choice out of ignorance (https://en.wikipedia.org/wiki/Principle_of_maximum_entropy). In this case you do not want to know whether the population is normally distributed, rather you want to know whether the normal distribution is a reasonable approximation for whatever your next step will be.
In that case you should provide your data (or generated data that is similar) along with a description of what you plan to do with it, then ask "In what ways may assuming normality in this case mislead me?"