10

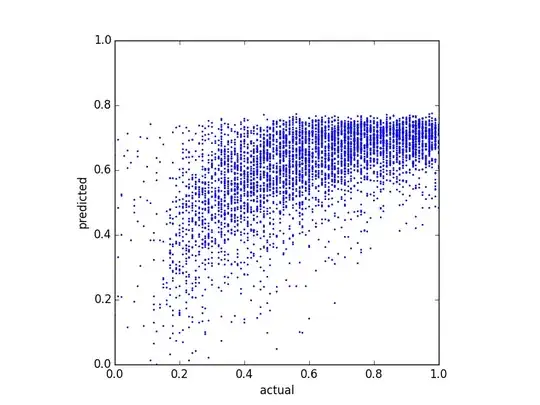
I try to predict a balance score and tried several different regression methods. One thing I noticed is that the predicted values seem to have some kind of upper bound. That is, the actual balance is in $[0.0, 1.0)$, but my predictions top at about $0.8$. The following plot shows the actual vs. the predicted balance (predicted with linear regression):

actual vs predicted

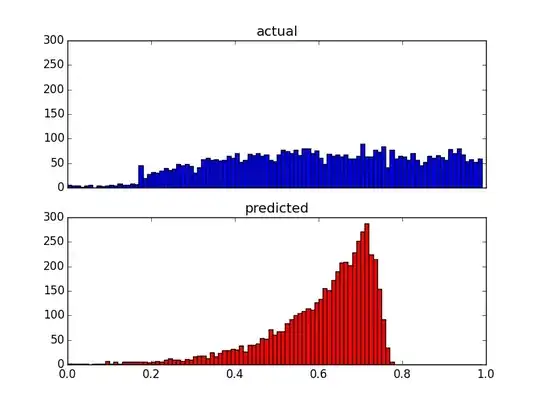
And here are two distribution plots of the same data:

initial distribution

Since my predictors are very skewed (user data with power law distribution), I applied a Box-Cox transformation, which changes the results to the following:

actual vs predicted after Box-Cox transformation

distribution after Box-Cox transformation

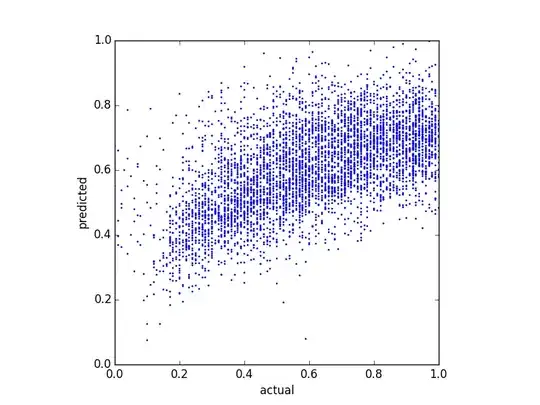
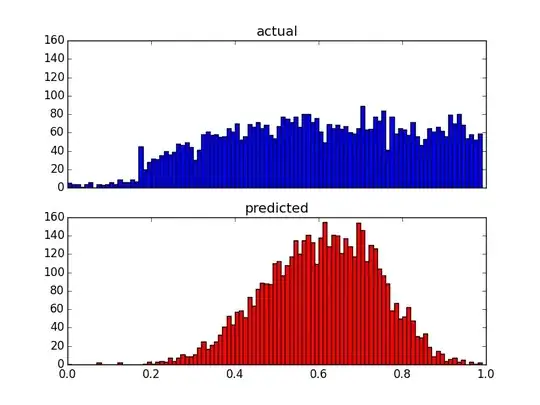
Although it changes the distribution of the predictions, there is still that upper bound. So my questions are:

  • What are possible reasons for such upper bounds in prediction results?
  • How can I fix the predictions to correspond to the distribution of the actual values?

Bonus: Since the distribution after the Box-Cox transformation seems to follow the distributions of the transformed predictors, is it possible that this is directly linked? If so, is there a transformation I can apply, to fit the distribution to the actual values?

Edit: I used a simple linear regression with 5 predictors.

Mennny
  • 201
  • 1
  • 3
  • I'm not able to see any plots here. Could you please include them? Thanks ! – Learner Mar 23 '15 at 12:34
  • Sorry for that. I now also added the direct URLs to the plots. Can you open them? – Mennny Mar 23 '15 at 12:43
  • No, you have to use the "Image Icon" to upload a image here.. – Learner Mar 23 '15 at 12:45
  • 1
    I'm really interested to see where this goes. This is just a linear regression model? How many predictors? – shadowtalker Mar 23 '15 at 12:49
  • @Learner: Fixed it. – Mennny Mar 23 '15 at 13:42
  • @ssdecontrol: Simple linear regression with 5 predictors. I also updated the question. – Mennny Mar 23 '15 at 13:45
  • 1
    As a side note: As your outcome variable is bounded by 0 and 1, a simple linear regression model will likely predict values outside of those bounds which is of course invalid. There are [other options](https://stats.stackexchange.com/questions/29038/regression-for-an-outcome-ratio-between-0-and-1) to consider in this case. – COOLSerdash Mar 23 '15 at 13:49
  • 1
    Bounded input implies bounded output for a linear model. What are the bounds on the (transformed) predictors? Can you show us a summary table of the model fit? – cardinal Mar 23 '15 at 13:58
  • @COOLSerdash: Thank you for pointing that out. I will have a look into "beta regression" as suggested in the question you linked. – Mennny Mar 23 '15 at 15:55
  • @cardinal: That is a really good point! I totally missed that. I use scikit learn, which doesn't have an R-like summary I think. However, I will update the question with more info about the predictors shortly. – Mennny Mar 23 '15 at 16:04
  • 3
    Mennny: All you really need (to start with) are the coefficient values and the bounds on the predictors. By matching signs one-by-one, you can quickly determine the minimum and maximum prediction (assuming the predictors will always satisfy the bounds, either implicitly or explicitly). – cardinal Mar 23 '15 at 16:43
  • 2
    @cardinal: I checked the bounds of the predictors and was able to confirm your assumption. With the given (untransformed) predictors the maximum prediction is ~0.79. Can you please "copy/paste" your comment as an answer so that I can accept it? How can I proceed? I guess this shows that there is no linear relationship between my predictors and the outcome? – Mennny Mar 24 '15 at 09:00
  • The odd thing here is that your -predicted- variables are not rising above 0.8, but your -actual data is-. Do you think you are missing a critical variable that allows your LPM to cross 1, perhaps an interaction term? – RegressForward Apr 04 '15 at 17:05
  • What is the functional form of the model? – Aksakal May 07 '15 at 18:22
  • The *impression* of a bound near 0.8 doesn't mean there actually is a bound. It may just be that the upper tail is so light that the chances of getting a value above ~0.8 are quite small. – Glen_b Sep 24 '15 at 02:08

2 Answers2

1

Your dep var is bounded between 0 and 1 and thus OLS is not fully appropriate, I suggest beta regression for instance, and there may be other methods. But secondly, after your box-cox transformation, you say that your predictions are bounded, but your graph doesn't show that.

0

While there is a lot of focus on using regressions that obey the bounds of 0/1, and this is reasonable (and important!), the specific question of why your LPM does not predict results greater than 0.8 strikes me as a slightly different question.

In either case, there is a noted pattern in your residuals, namely, your linear model fits the upper tail of your distribution poorly. This means there is something nonlinear about the correct model.

Solutions that also consider the 0/1 bound of your data: probit, logit, and beta regression. This bound is critical and must be addressed for your work to be rigorous, given your relatively close to 1 distribution, and thus the large number of answers on that topic.

Usually, though, the problem is that a LPM exceeds the 0/1 bound. This is not the case here! If you are not concerned with the 0/1 bound and actively want a solution that can be fitted with (x'x)^-1(x'y), then consider that perhaps the model is not stictly linear. Fitting the model as a function of x^2, cross products of independent variables, or logs of independent variables can help improve your fit and possibly improve the explanatory power of your model so that it estimates values greater than 0.8.

RegressForward
  • 1,254
  • 7
  • 13