I have been trying to do Principal Component Analysis (PCA) via R.
The data set is available at https://www.dropbox.com/s/s3jstl8pu1e1xcp/Cars.csv?dl=0
I tried to do PCA via 2 different methods -
- prcomp
- princomp
I have used correlation matrix as all the variables are on different scales. Whilst, I can understand a slight difference, there appears to be a major difference between the two. I have illustrated the same below -
car <- read.csv("D:/Cars.csv")
car <- car[,c(2:7)]
pc <- princomp(car, score=TRUE, cor=TRUE)
pca <- prcomp(car, score=TRUE, cor=TRUE)
summary(pca); summary(pc)
The result of the above is -
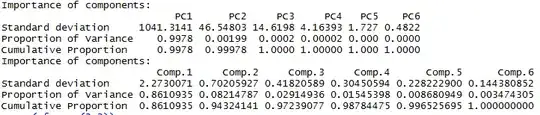
We can see the summary of the prcomp method above and the princomp method below.
As visible, both are extremely different : in the sdev as well as the proportion of variance.
Further, their respective components are also vastly different, as is visible below -
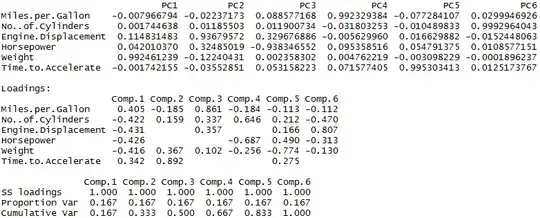
prcomp is above and princomp is below in the pic, once again.
Can somebody please explain as to why there is such a huge difference between the two ? Also, are these two methods the correct ones to perform PCA or should I go ahead with a different method (e.g. PCA() )
Thanks in advance :)