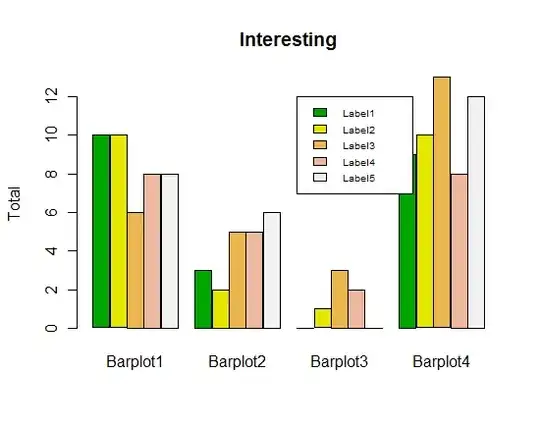
I would like to plot four barplots on a single graph in R. I have used the following code. Here, how can keep a legend on top of the graph, specifically the legend should be between 2 and 3 barplots. I also tried with par(mar=c(4.1,4.1,8.1,4.1) but there is no success. Moreover, I also tried to run legend() after the second barplot, but there is no use. The legend is for all the four barplots. Please help me in this.
    par(mfrow=c(1,4))
    barplot(t(A), beside=T, ylim=c(-100,100),..)
    barplot(t(B), beside=T, ylim=c(-100,100),..)
    barplot(t(C), beside=T, ylim=c(-100,100),..)
    barplot(t(D), beside=T, ylim=c(-100,100),..)
    legend(...)