I've used the R packages DESeq2 and ggplot2 and the following code
vsd <- varianceStabilizingTransformation(dds)
data <- plotPCA(vsd, intgroup=c("condition"), returnData=TRUE)
percentVar <- round(100 * attr(data, "percentVar"))
plotPCA <- ggplot(data, aes(PC1, PC2, color=condition)) +
geom_point(size=3) +
  xlab(paste0("PC1: ",percentVar[1],"% variance")) +
  ylab(paste0("PC2: ",percentVar[2],"% variance")) +
  geom_text(aes(label=names),hjust=0.25, vjust=-0.5, show_guide = F)
ggsave("PCA.pdf", plot = plotPCA)
to produce the following PCA plot:
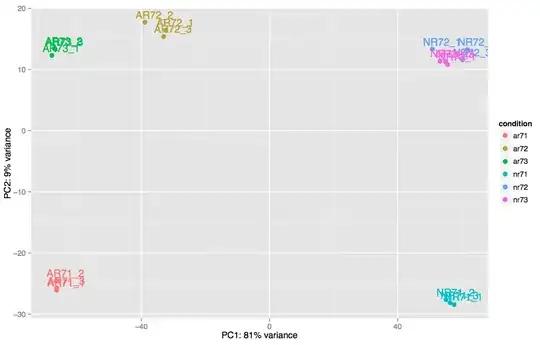
I know the axes are the principal components but I am confused by the units displayed. I thought the axes of a PCA plot are unit-less. But then I did image search on Google for "PCA plot" and saw tons of plots displaying units on their axes. Does anyone know what is the meaning of these units?