3

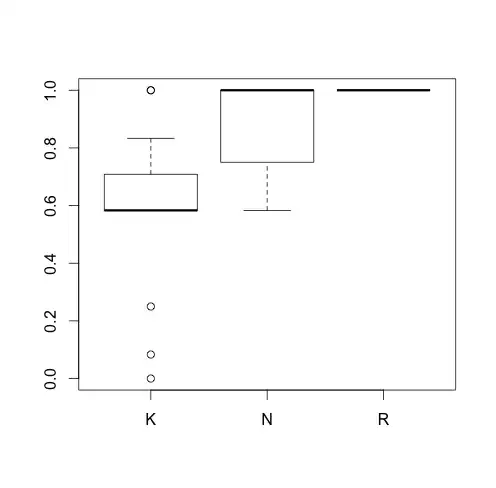
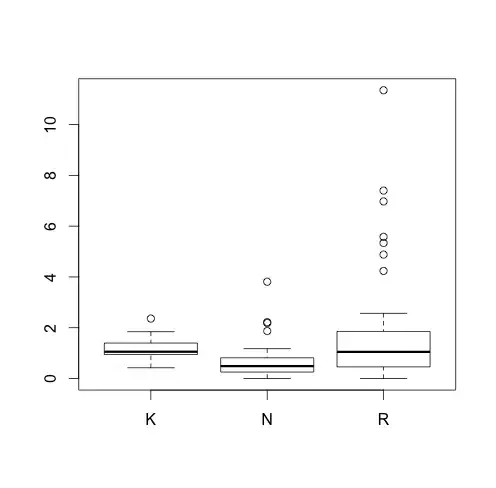
Is it possible to say that my samples are significantly different (or not) from each other just by looking a box plots? If yes, what do I have to look at and what is the theory behind it?

I read something about notches which can be drawn at each side of the boxes, and if they do not overlap, the medians are significantly different at the 5%, but I don't know how to do this in R?

The sample size is K:19, R:35 and N:30 but I have also data that contains only 5 data points in K, 7 in R and 10 in N

Thanks a lot for your help!

Example 1 Example 2

Glen_b
  • 257,508
  • 32
  • 553
  • 939
Katharina
  • 41
  • 5
  • Do you have any way of knowing how many data are represented by each box? – gung - Reinstate Monica Feb 08 '15 at 20:54
  • 1
    The case where there are no points outside (Q1-1.5IQR,Q3+1.5IQR), so that you're working ony with he five number summary, is discussed [here](http://stats.stackexchange.com/questions/86931/statistical-test-for-two-distributions-where-only-5-number-summary-is-known). – Glen_b Feb 08 '15 at 22:17
  • yes, in total there are 5 data points in K, in R:7 in N:10 – Katharina Feb 08 '15 at 22:18
  • yes, in both plots are 19 data points in K, in R:35 in N:30. But I also have plots with very few data points, as 5, 9 and 10. I am not allowed to perform any test and should only argue about the significance with the plots. – Katharina Feb 08 '15 at 22:24
  • 1
    Are you only interested in comparing pairwise or do you want one overall hypothesis test? – Glen_b Feb 08 '15 at 23:29
  • Are those two plots transformed versions of the same data, or are they different data sets? (I presume they're different data sets from the look of the $K$ values, but it might make a difference to what you can say, so I thought I'd check) – Glen_b Feb 08 '15 at 23:38
  • 1
    Just noticed this in comments:"*I am not allowed to perform any test*". ... Oh, well, then my answer (and the other one) is useless. You should not talk about "significance" in your question, because that *implies* you want a significance test. Please fix your question so that it *doesn't* ask about significance (and put the part about not being allowed to test in the question itself), add all the additional information from your comments, make it clear if you're doing coursework (& if so, add the `self-study` tag and read the [tag wiki](http://stats.stackexchange.com/tags/self-study/info)). – Glen_b Feb 08 '15 at 23:51
  • 1
    [Here](https://sites.google.com/site/davidsstatistics/using-r/notched-box-plots) is an example on how to add notches to your boxes in R. – Penguin_Knight Feb 10 '15 at 16:47
  • Thank you Penguin_Knight, it works fine with the notches, and I also found the theory for it. – Katharina Feb 11 '15 at 16:13

2 Answers2

5

(This section addresses the original question)

If we were looking for some relatively formal test, then speaking in general, if there's plenty of points outside the whisker ends, you could maybe get somewhere with a generalization of a two-sample Anderson-Darling type statistic, like so. Since the Anderson Darling approach focuses more on the tails than say a Kolmogorov-Smirnov, the differences in the tails might be sufficient.

However, I think in this case (since it now appears that you know $n$'s, not just lower bounds based on the tails) that you could perhaps also construct envelopes that put lower bounds on the difference in CDFs for a Kolmogorov-Smirnov type test. This could be generalized to a k-sample statistic.

This test would have low power typically, but when you lose most of the information in your data, that's how it goes.


Outside of formal testing:

In the case of direct comparison of boxes, Arnold et al (2011)[1] give a number of rules of thumb, some of which are both simple to apply and with reasonable properties (see p5 for a list of increasingly sophisticated rules). In many stats packages, notched boxplots are available and can be used.

[1]: Arnold P., Pfannkuch M., Wild CJ, Regan M, and Budgett S (2011),
"Enhancing Students' Inferential Reasoning: From Hands-On To 'Movies',"
Journal of Statistics Education, 19:2
pdf link
Glen_b
  • 257,508
  • 32
  • 553
  • 939
  • Thank you. the paper you suggested is what I looked for initially – Katharina Feb 11 '15 at 16:22
  • There are other rules of thumb around than those ones (which you might have been expected to use instead), but that's a collection of good, carefully constructed rules. – Glen_b Feb 11 '15 at 20:58
-1

If you have the entire CDF, you might want to look at the Kolmogorov-Smirnoff two-sample test:

http://en.wikipedia.org/wiki/Kolmogorov%E2%80%93Smirnov_test

Vimal
  • 1,047
  • 8
  • 16
  • The question was about using "just boxplots". K-S test is not related to the question and problem presented in the question. – Tim Feb 10 '15 at 19:11