I have two variables: y= head (0.5,0.10,0.15,0.25,0.34) and x= instar (1, 2, 3, 4,5). How fitting my data on exponential growth in R? I need p-value fitting, F (is possible?), R^2 and degree freedom.
I didn't find information about this.
I have two variables: y= head (0.5,0.10,0.15,0.25,0.34) and x= instar (1, 2, 3, 4,5). How fitting my data on exponential growth in R? I need p-value fitting, F (is possible?), R^2 and degree freedom.
I didn't find information about this.
You don't give enough information to know which of many choices would be suitable for your problem.
Here's one to start off with:
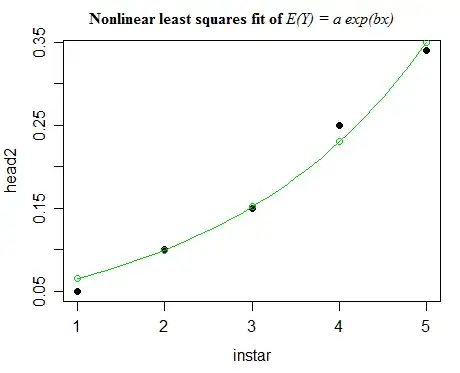
Nonlinear least squares. $Y=ae^{bx}+\varepsilon$
For this you might use a nonlinear least squares fit. Here's an example of one in R:
head=c(0.5,0.10,0.15,0.25,0.34);instar=c(1, 2, 3, 4,5)
head2=head;head2[1]=head[1]/10 # fixing presumed typo. (Was it a typo?)

growth=nls(head2~a*exp(b*instar),start=list(a=1,b=1))
summary(growth)

plot(head2~instar,pch=16)
points(fitted(growth)~instar,col=3)
lines(predict(growth,newdata=data.frame(instar=xx))~xx,col=3)


> growth=nls(head2~a*exp(b*instar),start=list(a=1,b=1))
> summary(growth)

Formula: head2 ~ a * exp(b * instar)

Parameters:
  Estimate Std. Error t value Pr(>|t|)
a 0.043299   0.006643   6.518  0.00734 **
b 0.417661   0.034697  12.037  0.00123 **
---
Signif. codes:  0 ‘***’ 0.001 ‘**’ 0.01 ‘*’ 0.05 ‘.’ 0.1 ‘ ’ 1

Residual standard error: 0.01564 on 3 degrees of freedom

Number of iterations to convergence: 8
Achieved convergence tolerance: 5.725e-06
You could calculate an F-statistic for comparing two nested models as
$$F=\frac{(\text{SS}_1-\text{SS}_2)/(\text{df}_1-\text{df}_2)}{s^2}$$
Where $\text{SS}_1$ and $\text{SS}_2$ in the numerator would be the sum of squares of error in the smaller (more restricted) model and the larger (unrestricted) model respectively, and the df figures are the respective error degrees of freedom for both models, and $s^2$ is $\text{SS}_2/\text{df}_2$. This applies whether under the restricted model parameters are set to 0, 1 or some other value, and for any number of parameters being tested.
Gamma GLM
$E(Y_i)=\mu_i=ae^{bx_i}$, fitted as a Gamma GLM with log-link; $\log(\mu_i)=\eta_i=a+bx_i$
This model has variance proportional to mean$^2$ (the variance of the log is constant).
This is fitted quite easily. For example:
> glmfit=glm(head2~instar,family=Gamma(link=log))
> summary(glmfit)

[A few lines omitted from the output]

Coefficients:
            Estimate Std. Error t value Pr(>|t|)
(Intercept) -3.35117    0.11870  -28.23 9.76e-05
instar       0.47433    0.03579   13.25 0.000928
---
(Dispersion parameter for Gamma family taken to be 0.01280805)

    Null deviance: 2.061365  on 4  degrees of freedom
Residual deviance: 0.039101  on 3  degrees of freedom
AIC: -23.38
Instead of an F-test, you have a test of deviance, which is asymptotically chi-square. [Some people do an F-test; which often seems to work well enough with the Gamma.]
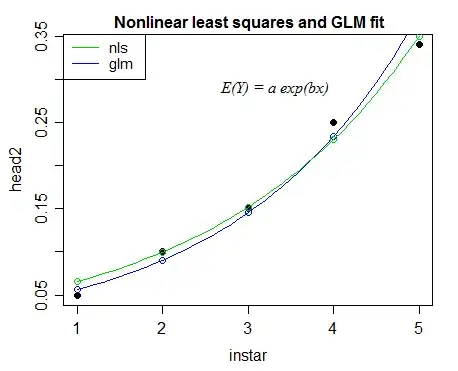
Because of the differing variance assumption, nonlinear least squares will tend on average to give a closer fit to the larger values than the GLM, and the GLM will tend on to give a relatively closer fit to the smaller values.
There are numerous other models that will give an exponential fit! For example, one is discussed in this post.
I'll try to come back with some more details as well as some alternative models.