6

The density of my data set was plotted in R as follows.

enter image description here

What kind of distribution would fit this data?

As I am not experienced to tell by visualization, I can only guess it is not normally distributed. I shall test it with R: some guidance as a starting point is highly desirable.

Jeromy Anglim
  • 42,044
  • 23
  • 146
  • 250
evdstat
  • 561
  • 4
  • 7
  • 13
  • Does it has discrete or continuous values? –  Jul 26 '11 at 10:33
  • Does your data has negative values? – Dmitrij Celov Jul 26 '11 at 10:39
  • @Dimitrij I doubt it - the default for `density` in R assumes unbounded data hence the bleeding of density below zero. – Gavin Simpson Jul 26 '11 at 12:22
  • 1
    @Gavin, I doubt it myself, it looks like being from exponential or Gamma distribution, but more info would on the data source would be nice to know. – Dmitrij Celov Jul 26 '11 at 14:40
  • @Dmitrij, The values itself has no negative data. I know most of the model need to have negative data. Since I am only interested in the trend, not absolute value. I scale all values by a constant mean and a constant std dev. Then, I transformed all data using the equation of calculating Z-score, to make the number has both positive and negative value before fitting. Is it a reasonable approach? – evdstat Jul 27 '11 at 01:38
  • @Gavin Could you mind to comment on the z-score approach in my reply to Dmitrij? – evdstat Jul 27 '11 at 01:39
  • @mdq It is about hard to define. One of my dataset has 545490 datapoints, and most of them has dec. place numbers. So, I suspect I should define it as continuous. Do you think it is reasonable to define it as continuous? – evdstat Jul 27 '11 at 02:08
  • @evdstat, it is still not clear what kind of a data it is. For example if it is some time between two events, then http://en.wikipedia.org/wiki/Exponential_distribution seems relevant (or some Gamma or Weibull for more flexible density fit). Note, that the choice is somewhat application dependent, in survival analysis for instance Weibull is common, though I prefer Gamma family, both include exponential as a separate case. – Dmitrij Celov Jul 27 '11 at 09:21
  • @evdstat: This looks to me like it's coming from a distribution with heavy tails, such as a Frechet distribution or an inverse gamma distribution or mayby a Pareto distribution. I'd be interested in knowing more about the source of these data. Marketing? – Hans Engler Aug 21 '11 at 13:58
  • Here's an old answer: http://stats.stackexchange.com/questions/8662/need-help-identifying-a-distribution-by-its-histogram/8674#8674 – bill_080 Aug 22 '11 at 02:10
  • Reminds me of a Weibull distribution I fitted with some "weird" parameters. – Roman Luštrik Oct 30 '12 at 08:01

4 Answers4

4

It looks rather like an exponential distribution (assuming that the bit below 0 is an artifact of smoothing in the density estimation).

I would look at a qqplot. In R, if x contains your data:

n <- length(x)
qqplot(x, qexp( (1:n - 0.5)/n ) )

Note that in the use of density() for the non-negative case, it is best to use from=0 since you know the density is 0 below 0.

plot(density(x, from=0))

I think also that, if $X$ follows an exponential distribution, then $e^{-X/\mu_X}$ should follow a uniform distribution, so the following could be a reasonable diagnostic:

hist(exp(-x/mean(x)), breaks=2*sqrt(length(x)))
Karl
  • 5,957
  • 18
  • 34
3

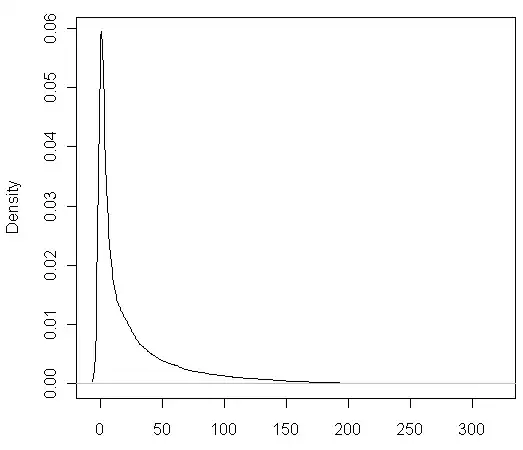
It's not usually possible to identify a distribution from looking at a histogram like this.

As a start, plot the density on a log scale:

Log density plot

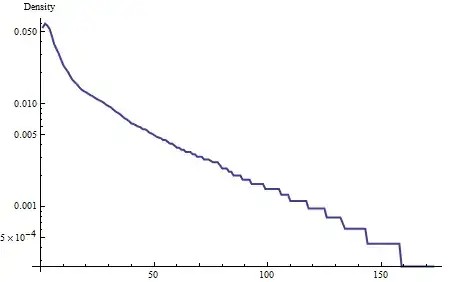
The tail of this density (from around 40 onward) is close to linear, showing it is close to exponential. That's part of the characterization. To go further, compare the density to this characterization by forming the residuals (on a log scale, effectively taking the ratio of the density to an exponential curve):

Residuals

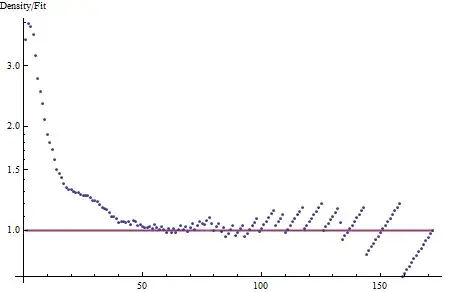
Clearly this density is not exponential: for small values it is almost four times greater than the exponential fit to the tail would indicate. We must go further with the characterization.

We seek to characterize the residuals as simply as possible: this means in terms of longish straight segments or parabolic sections. (On this log scale, a straight segment is an exponential trend, whereas a parabolic section looks like a piece of a Normal distribution.) Evidently there are two parabolic-like sections: a sharp peaked one centered near 1 and a shallow, broad one centered near 25-30. The first would correspond to a healthy part of a truncated Normal distribution with small standard deviation (around 5-6) whereas the second would correspond to most of a Normal distribution with a larger standard deviation (around 10 perhaps). This indicates the density is not going to be adequately described by a simple mathematical formula, such as a Gamma or Weibull, but perhaps it can be decomposed into a mixture of two or three components. Look for each of those components to have some meaning: could these data indeed involve some combination of phenomena tending to occur near 1, near 25, and out beyond 40?

whuber
  • 281,159
  • 54
  • 637
  • 1,101
1

Assuming, as others have, that the small blip below zero is an artifact of a density smoothing process, rather than a small amount of negative data, your distribution looks like an exponential distribution.

I'd start with either a exponential distribution, or the slightly more flexible Weibull distribution, and see if either one of those seems to fit well. Those two are a decent balance between difficulty to implement, visualize, etc. and having a decent likelihood of fitting your data.

Fomite
  • 21,264
  • 10
  • 78
  • 137
1

This is a long-tail distribution. GB2 (Generalized beta of second kind) with four parameters has a good flexibility for this kind of data. It's in package GB2.

Mahmoud
  • 383
  • 1
  • 2
  • 14