29

Having recently studied bootstrap, I came up with a conceptual question that still puzzles me:

You have a population, and you want to know a population attribute, i.e. $\theta=g(P)$, where I use $P$ to represent population. This $\theta$ could be population mean for example. Usually you can't get all the data from the population. So you draw a sample $X$ of size $N$ from the population. Let's assume you have i.i.d. sample for simplicity. Then you obtain your estimator $\hat{\theta}=g(X)$. You want to use $\hat{\theta}$ to make inferences about $\theta$, so you would like to know the variability of $\hat{\theta}$.

First, there is a true sampling distribution of $\hat{\theta}$. Conceptually, you could draw many samples (each of them has size $N$) from the population. Each time you will have a realization of $\hat{\theta}=g(X)$ since each time you will have a different sample. Then in the end, you will be able to recover the true distribution of $\hat{\theta}$. Ok, this at least is the conceptual benchmark for estimation of the distribution of $\hat{\theta}$. Let me restate it: the ultimate goal is to use various method to estimate or approximate the true distribution of $\hat{\theta}$.

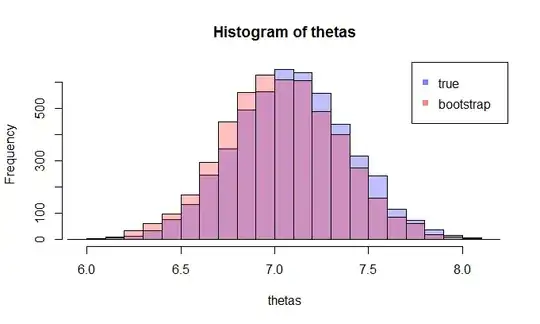
Now, here comes the question. Usually, you only have one sample $X$ that contains $N$ data points. Then you resample from this sample many times, and you will come up with a bootstrap distribution of $\hat{\theta}$. My question is: how close is this bootstrap distribution to the true sampling distribution of $\hat{\theta}$? Is there a way to quantify it?

Xi'an
  • 90,397
  • 9
  • 157
  • 575
KevinKim
  • 6,347
  • 4
  • 21
  • 35
  • 1
    This highly related [question](http://stats.stackexchange.com/questions/26088/explaining-to-laypeople-why-bootstrapping-works) contains a wealth of additional information, to the point of making this question possibly a duplicate. – Xi'an Jan 13 '15 at 10:40
  • First, thank you all for answer my questions so promptly. This is the first time I use this website. I never expected my question will draw anyone's attention honestly. I have a small question here, what is 'OP'?@Silverfish – KevinKim Jan 13 '15 at 14:40
  • @Chen Jin: "OP" = original poster (i.e. you!). Apologies for the use of an abbreviation, which I accept is potentially confusing. – Silverfish Jan 13 '15 at 14:48
  • 1
    I have edited the title so that it more closely matches your statement that "My question is: how close is this to the true distribution of $\hat\theta$? Is there a way to quantify it?" Feel free to revert it if you do not think my edit reflects your intention. – Silverfish Jan 13 '15 at 15:04
  • @Silverfish Thank you so much. When I start this poster, I am not quite sure about my question actually. This new title is good. – KevinKim Jan 13 '15 at 15:46
  • I just noticed you never picked/validated one of the two answers below as answering your question. Are you waiting for more material or are you expecting a different answer? – Xi'an Nov 11 '15 at 10:35

2 Answers2

23

Bootstrap is based on the convergence of the empirical cdf to the true cdf, that is, $$\hat{F}_n(x) = \frac{1}{n}\sum_{i=1}^n\mathbb{I}_{X_i\le x}\qquad X_i\stackrel{\text{iid}}{\sim}F(x)$$ converges (as $n$ goes to infinity) to $F(x)$ for every $x$. Hence convergence of the bootstrap distribution of $\hat{\theta}(X_1,\ldots,X_n)=g(\hat{F}_n)$ is driven by this convergence which occurs at a rate $\sqrt{n}$ for each $x$, since $$\sqrt{n}\{\hat{F}_n(x)-F(x)\}\stackrel{\text{dist}}{\longrightarrow}\mathsf{N}(0,F(x)[1-F(x)])$$ even though this rate and limiting distribution does not automatically transfer to $g(\hat{F}_n)$. In practice, to assess the variability of the approximation, you can produce a bootstrap evaluation of the distribution of $g(\hat{F}_n)$ by double-bootstrap, i.e., by bootstrapping bootstrap evaluations.

As an update, here is an illustration I use in class: enter image description here 
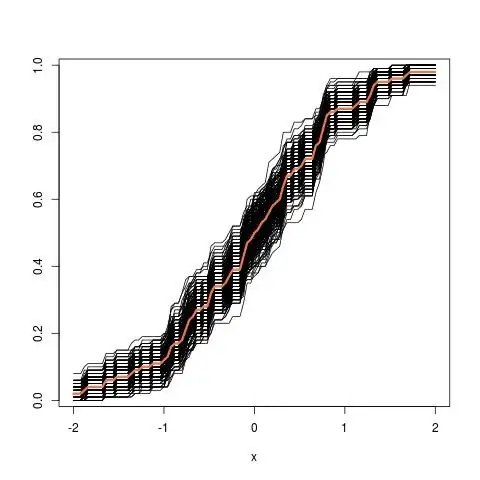
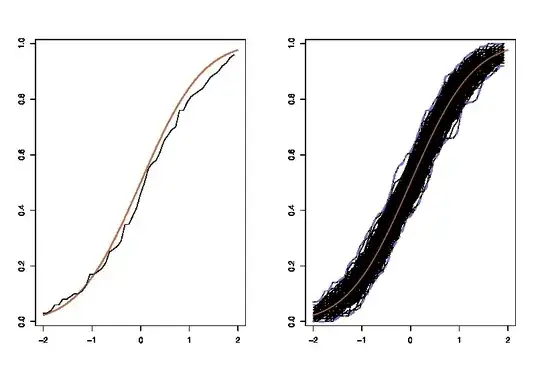
where the lhs compares the true cdf $F$ with the empirical cdf $\hat{F}_n$ for $n=100$ observations and the rhs plots $250$ replicas of the lhs, for 250 different samples, in order to measure the variability of the cdf approximation. In the example I know the truth and hence I can simulate from the truth to evaluate the variability. In a realistic situation, I do not know $F$ and hence I have to start from $\hat{F}_n$ instead to produce a similar graph.

Further update: Here is what the tube picture looks like when starting from the empirical cdf: enter image description here

Xi'an
  • 90,397
  • 9
  • 157
  • 575
  • 5
    The crux of this answer is that **the bootstrap works because it is a large-sample approximation**. I don't think this point is emphasized enough – shadowtalker Jan 13 '15 at 14:52
  • 2
    I mean, "emphasized often enough in general" – shadowtalker Jan 13 '15 at 15:52
  • @Xi'an Thanks a lot. I like the last 2 panels, so in this example, let's pretend we don't know the true cdf, i.e. the red curve on the lhs, I just have the empirical cdf $\hat{F}$ from one sample of $n=100$. Then I do resampling from this sample. Then I produce a similar graph as the rhs. Will this new graph has a wider tube than the current tube on your current rhs figure? And will the new tube still centered around the true cdf, i.e. the red curve as the tube on you current rhs figure? – KevinKim Jan 13 '15 at 15:52
  • 3
    The tube produced by creating empirical cdfs based on samples created from one empirical cdf is eventually less wide than the one produced from the true $F$ as we are always using the same $n$ datapoints. And the new tube is centred around the empirical cdf, not the true $F$. There is thus bias in scale and location for that tube. – Xi'an Jan 13 '15 at 16:01
  • @Xi'an Very nice! it would be even nicer if the 2nd and 3rd figure can be combined together in one figure – KevinKim Jan 13 '15 at 16:10
  • Then why do we use/trust bootstrap when we have small sample sizes? How well does the method work then. Is there any study for known distributions, for example for the normal? – skan Nov 09 '18 at 00:37
  • As indicated above the method works at the parametric speed $\sqrt{n}$. One uses bootstrap when one does not want to make any parametric assumption. – Xi'an Nov 09 '18 at 04:28
20

In Information Theory the typical way to quantify how "close" one distribution to another is to use KL-divergence

Let's try to illustrate it with a highly skewed long-tail dataset - delays of plane arrivals in the Houston airport (from hflights package). Let $\hat \theta$ be the mean estimator. First, we find the sampling distribution of $\hat \theta$, and then the bootstrap distribution of $\hat \theta$

Here's the dataset:

enter image description here

The true mean is 7.09 min.

First, we do a certain number of samples to get the sampling distribution of $\hat \theta$, then we take one sample and take many bootstrap samples from it.

For example, let's take a look at two distributions with the sample size 100 and 5000 repetitions. We see visually that these distributions are quite apart, and the KL divergence is 0.48.

enter image description here

But when we increase the sample size to 1000, they start to converge (KL divergence is 0.11)

enter image description here

And when the sample size is 5000, they are very close (KL divergence is 0.01)

enter image description here

This, of course, depends on which bootstrap sample you get, but I believe you can see that the KL divergence goes down as we increase the sample size, and thus bootstrap distribution of $\hat \theta$ approaches sample distribution $\hat \theta$ in terms of KL Divergence. To be sure, you can try to do several bootstraps and take the average of the KL divergence.

Here's the R code of this experiment: https://gist.github.com/alexeygrigorev/0b97794aea78eee9d794

Alexey Grigorev
  • 8,147
  • 3
  • 26
  • 39
  • 5
    +1 and this also shows that for any given sample size (like e.g. 100), bootstap bias can be large and unavoidable. – amoeba Jan 13 '15 at 14:40
  • 1
    This one is awesome! So in order to let the distribution of $\hat{\theta}$ from the bootstrap be close to the TRUE distribution of $\hat{\theta}$, we need large sample size $N$ right? For any fixed sample size, distribution generated from the bootstrap can be very different from the TRUE distribution as mentioned by @amoeba. – KevinKim Jan 13 '15 at 14:52
  • My next question is: If I fixed $N$ large enough, then I did 2 bootstraps, one just resample $B=10$ times, and the other resample $B=10000$. What's the difference between the distribution of $\hat{\theta}$ coming out of these 2 bootstraps? This question is essentially asking when we fix $N$, what's the role played by $B$ in generating distribution of $\hat{\theta}$. @Grigorev – KevinKim Jan 13 '15 at 14:52
  • 1
    @Chen, but the *distribution* of $\hat \theta$ is something that you obtain by doing resamples, right? So the difference between $B=10$ and $B=10000$ is that in one case you get $10$ numbers to build your distribution (not much information $\Rightarrow$ not very reliable estimate of its standard deviation), and in other case you get $10000$ numbers (much more reliable). – amoeba Jan 13 '15 at 14:54
  • Can I think like the following: the TRUE distribution of $\hat{\theta}$, i.e., $F$ exists conceptually. Now someone says we have a 'large' sample, then if we do $B=\infty$ resample from this large sample, we will get the 'TRUE Bootstrap' distribution of $\hat{\theta}$, i.e., $F_B$ from this sample. Note that $F_B$ still does not equal to $F$. Now if we only resample say $B=5$, then the distribution $F_5$ certainly will not equal to $F_B$ and hence will be far away from $F$. So increase $B$ close the gap between say $F_5$ and $F_B$. Increase $n$ close the gap between $F_B$ to $F$. @amoeba – KevinKim Jan 13 '15 at 15:04
  • 1
    @Chen, I think you are either a bit confused or not being very clear about what $F_5$ in your comment is supposed to be. If you resample $5$ times, you get a set of $5$ numbers. How is that a distribution? It is a set of numbers! These numbers *come from* what you called $F_B$ distribution. The more numbers you get, the better you can estimate $F_B$. – amoeba Jan 13 '15 at 15:07
  • This answer is very nice. I have a feeling that "thus bootstrap distribution of θ approaches sample distribution θ" should probably say "sampling distribution"? ("Sample distribution" is often used to mean the distribution of data in a single, as opposed to the "sampling distribition" of a statistic over repeated resampling.) Incidentally, I'd be tempted to put "hats" on the thetas for consistency with the original question. – Silverfish Jan 13 '15 at 15:12
  • thanks @Silverfish, I edited the post to address your comments. – Alexey Grigorev Jan 13 '15 at 15:19
  • @amoeba Sorry about the confusion. It should be the following. The TRUE distribution of $\hat{\theta}$ is $F$. If we have a 'large' sample and we do $B=\infty$ bootstrap from this large sample, we'll get $F^b_{\infty}$, which is close (depends on how large the original sample size is) but not equal to $F$. Now if we only do resample 5 times from the original sample, then are also able to get a distribution, call it $\hat{F}^b_{\infty}$, which will be far from $F^b_{\infty}$. So theoretically, we should resample as many times as we can so as to get close to $F^b_{\infty}$. – KevinKim Jan 13 '15 at 15:40
  • @Chen: I am sorry, but I can only repeat my previous comment... Please read it carefully. *"If we only do resample 5 times from the original sample, then are also able to get a distribution"* -- this is wrong (or at least sloppy)! If you resample 5 times, you will get 5 numbers. Five numbers is not a distribution!! These five numbers will be **SAMPLED** from the distribution $F^b_\infty$ but they will not **BE** a distribution themselves. – amoeba Jan 13 '15 at 15:55
  • @AlexeyGrigorev I just want to make sure that I understand your figures. So the 1st figure is our 'Population' right? In the 2nd figure the 'true' is obtained from fix sample size $N=100$ and draw with replacement from the 'Population' 5000 times right? And the bootstrap in 2nd figure is obtained by randomly pick a sample with $N=100$ from the 'Population', then resampling from this specific sample for 5000 times right? The 3rd and 4th figures are similar but with $N=1000,5000$ and still fixed the number of bootstrap to be 5000 right? – KevinKim Jan 13 '15 at 16:22
  • @amoeba I am still a little bit confused. Say the specific sample I used to conduct bootstrap is $X$. Conceptually, if I do resampling from $X$ infinitely many times and each time compute my $\hat{\theta}$, then I'll get the cdf of $\hat{\theta}$ call it $F^b_{\infty}$. Now if I resample only 5 times from $X$, then I got 5 numbers of $\hat{\theta}$, I could plot the histogram, that's my $\hat{F}^b_{\infty}$, i.e. it is a random function. This one should be far from $F^b_{\infty}$ right? But if I resample 50000 times, then my $\hat{F}^b_{\infty}$ should close to $F^b_{\infty}$ right? – KevinKim Jan 13 '15 at 16:36
  • @ChenJin yes that's right – Alexey Grigorev Jan 13 '15 at 16:54