This is a tricky question.
First, here I explained How can MANOVA report a significant difference when none of the univariate ANOVAs reaches significance?
Second, make sure that you understand the difference between using univariate ANOVAs and discriminant analysis as follow-ups for MANOVA; see my answer here: Post-hoc tests for MANOVA: univariate ANOVAs or discriminant analysis? The summary is that you use discriminant analysis if you want to find out which linear combination of your DVs leads to maximum group separability (usually in order to try to interpret this linear combination). This linear combination is called "[first] discriminant axis".
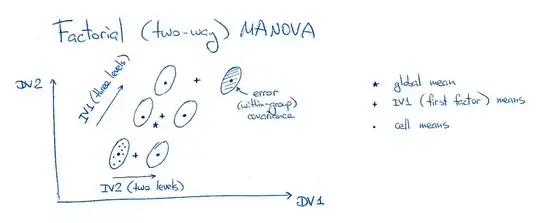
Third, as you say, there is no such thing as "factorial LDA"; I don't know about SPSS specifically, but I've never seen "factorial LDA" mentioned in the literature (I use "LDA" to refer to linear discriminant analysis). However, MANOVA is very intimately related to LDA, as I explain here in much detail: How is MANOVA related to LDA? So if you understand the math behind MANOVA/LDA, you can manually obtain discriminant axis for each of your factors -- i.e. three discriminant axes in total (for factor A, factor B, and for interaction AB). See in particular the Update to my answer in the linked post, regarding factorial MANOVA. I cross-post here my figure from that thread as an appetizer:
Note that these will be three different axes, i.e. three different linear combinations. What you suggested in the comments (to create a new "composite" interaction variable with 9 conditions and use it for LDA) is smart and not entirely meaningless, but would only result in one single [most discriminative] axis, and that is not what you probably want here. Instead, you want to see which linear combination of your DVs best separates levels of factor A, which one -- levels of factor B, which one -- levels of AB.
I have no idea whether this is implemented in SPSS (or in any other package); in the worst case, you might need to go through the computations yourself.