Here is a figure illustrating how it is possible:
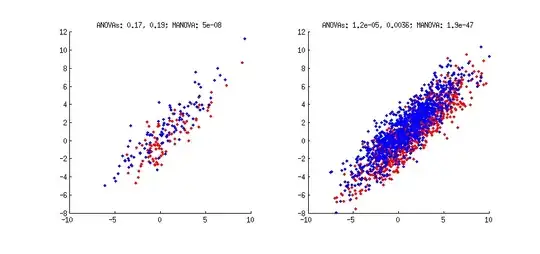
Two populations (red and blue) are sampled from a same 2D distribution, but slightly shifted from each other. On the left $N=100$, on the right $N=1000$ in each group. In both cases, I conduct two univariate ANOVAs (for $x$ dimension and for $y$ dimension) and one multivariate MANOVA.
P-values are reported in the titles. Note that on the left, both univariate tests yield non-significant p-values of around $0.2$, whereas MANOVA reports a very significant one. This happens because to separate the groups the data need to be projected onto a diagonal running from upper-left to lower-right corner of the subplot; projecting the data on either horizontal or vertical axes would not result in significant separation of the two groups. Finding such "optimal group-separating projection" is what discriminant analysis (LDA) and MANOVA both do (directly or indirectly).
It might not be obvious from the left figure that there is any difference between groups at all, but it should be evident on the right figure, where more points are sampled from the same distributions. Here univariate tests reach significance as well, but MANOVA is of course still much more sensitive.
[Note that in case of only one factor with only two levels (i.e. only two groups) ANOVA is equivalent to a t-test, and MANOVA is equivalent to a Hotelling's T2-test.]
Simulation code (Matlab):
Ns = [100 1000];

figure
for i=1:2
    subplot(1,2,i)

    X = randn(Ns(i),2);
    X = bsxfun(@times, X, [4 1]);
    X = X * [sind(45) cosd(45); cosd(45) -sind(45)];
    X = bsxfun(@plus, X, [1.5 1]);

    Y = randn(Ns(i),2);
    Y = bsxfun(@times, Y, [4 1]);
    Y = Y * [sind(45) cosd(45); cosd(45) -sind(45)];
    Y = bsxfun(@plus, Y, [1 1.5]);

    hold on
    scatter(X(:,1), X(:,2), 'r.')
    scatter(Y(:,1), Y(:,2), 'b.')
    axis([-10 10 -8 12])
    axis square

    [~, p1] = ttest2(X(:,1), Y(:,1));
    [~, p2] = ttest2(X(:,2), Y(:,2));
    [~, p3] = manova1([X; Y], [ones(size(X),1); 2*ones(size(X),1)]');

    title(['ANOVAs: ' num2str(p1,2) ', ' num2str(p2,2) '; MANOVA: ' num2str(p3,2)])
end