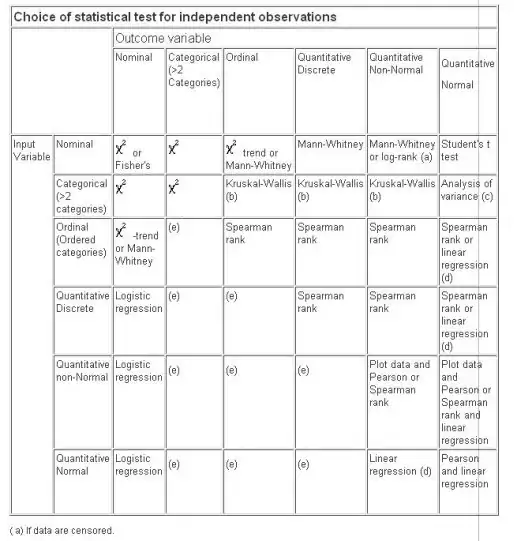
The first step is to plot the three histograms and see how much they overlap. If there is enough data to make a histogram (40+ samples) that can be used to identify if the distribution in each category is normally distributed or not, and they are normally distributed then doing t-test for paired means and Levene's test for difference in variance (i.e., standard deviation squared) will be powerful and allow for determining whether or not there is an organized difference between the groups either with respect to location of the continuous variable or its variability. Doing these tests as one-sided tests would allow for identifying how they rank with respect to each other, e.g. A>B>C or not. If there are fewer than 40 samples in each group, or if there is no method by which one can normalize the data, for example by taking reciprocals, logarithms, etc., then one should use Wilcoxon for difference of location and Conover for difference of variance as those "non-parametric" tests rank the results and do not require normal conditions for their use.
