Given two data sets of positive real numbers X and Y, both of the same size, and 0<=Y<=X for each row; can the empirical CDF of X ever cross the empirical CDF of Y?
Asked
Active
Viewed 351 times
3 Answers
4
The empirical cdf, $\hat{F}(t)$ is the proportion of the sample at or below $t$.
Consider ordering your rows by increasing $y$ (and at a fixed value of $y$, ordering by increasing $x$).
Then for each such row (row $i$, say), the height of each cdf is $i/n$*, and the corresponding abscissa for the x-sample is always to the right of the abscissa for the y-sample. The step-functions can coincide, but the x-sample ecdf will never be above/left of the y-sample ecdf.
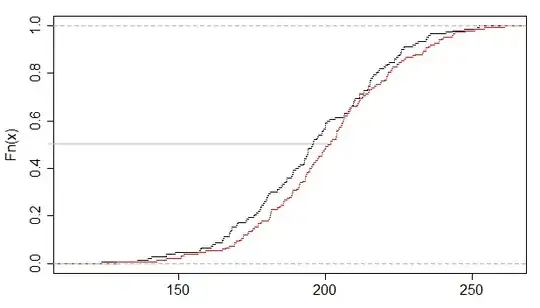
Indeed, imagine we "draw on the plot" all the vertical jumps in the ecdf. Then a horizontal line drawn across the plot at some value of $F$ will strike the ecdf steps at a particular value of $y$ and $x$ that appears in our table listing the sample values in order (indeed, for a given value of $F$, it's easy to work out which row it will be$^\dagger$), which always has $y_i\leq x_i$.
*(it's slightly more complicated when there are duplicate values, but not in a way that changes the argument substantively)
$\dagger$ For the grey horizontal line in the plot ($F\approx 0.481$), it strikes the vertical jumps of the ecdf at $t_y=194.4503$ and $t_x=200.0431$ which occur in the 73rd row of the data table when sorted as indicated earlier.
Glen_b
- 257,508
- 32
- 553
- 939
2
Glen_b's answer is correct, but I think there's an even simpler way to demonstrate this.
The eCDF is a plot of ($x$, proportion of values at or below $x$). We start by sorting the values in ascending order: call them $x_1, x_2, \ldots, x_n$ and $y_1, y_2, \ldots, y_n$. Furthermore, from your question, we know that the two vectors are the same length and $y_i \ge x_i$ for every index $i$.
Since $y_1$ is greater than or equal to $x_1$, $y_1$ must be located at or to the right of $x_1$ and, since they're the smallest points in the list, they both have a height/y-coordinate of $\frac{1}{n}$. Both curves move upwards at the same rate ($\frac{1}{n}$ per step) and to the right. However, since $y_i > x_i$, the $Y$ curve moves at least as far to the right as the $X$ curve on each step.
Since the $Y$ curve started at or out to the right of the $X$ curve and each subsquent update pushes $Y$ at least as far rightwards as $X$, the curves never cross.
Matt Krause
- 19,089
- 3
- 60
- 101
0
Just formalise what was written above:
If the emperical CDFs are written as $F_X$ and $F_Y$ respectively, then
$F_X(x) = \frac{1}{n} \sum_{x_i} I(x_i \leq x)$ and likewise $F_Y(x) = \frac{1}{n} \sum_{y_i} I(y_i \leq x)$.
Now, for any $x$, we can show that $I(x_i \leq x) \leq I(y_i \leq x)$. Prove this by contradiction - Suppose there was an $x$ where this didn't hold and show that there must be a pair $(x_i, y_i)$ for which $y_i > x_i$.
Thus, $F_X(x) \leq F_Y(x)$ for all $x$.
Note: There are some implicit assumptions in this demonstration that the number of data points are finite. I guess it is possible to have infinite data sets of the same size (ie cardinality). I'm fairly certain the result holds, but far less certain about the proof of such a result.
Jonathan
- 71
- 3
-
With infinitely many data points, exactly how would you define an empirical CDF? – whuber Jul 25 '15 at 21:15