7

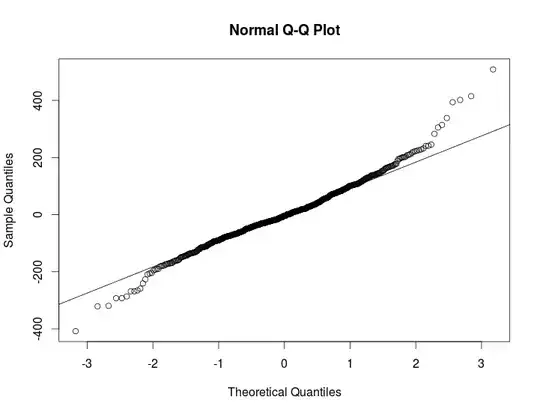
So I'm trying to determine whether the residuals from a seasonal ARIMA model are normal or not. Upon using the shapiro wilk test, I get a staggeringly low p-value leading me to think that the residuals are in fact non-normal. However, my qqplot seems acceptable for a decently large number of observations(~700). Shapiro-Wilk normality test

data:  residuals(housing.arima)
W = 0.979, p-value = 3.345e-08

enter image description here

In terms of exploratory data analysis, what's the standard thing for someone to do from here onwards, should I operate under the assumption that the residuals are not normal or otherwise? And also, are there any normality tests that are not as sensitive to the sample size?

user1943079
  • 131
  • 4
  • 3
    Statistical koan: Is distributed exactly normally? Answer: No. – Stumpy Joe Pete Dec 11 '14 at 07:49
  • 3
    If you think you should use a test with *less* power, that's a clear sign that a significance test not what you actually needed to do to begin with. So rather than 'take it with a pinch of salt', I'd instead say "what's a good reason to do it in the first place?" -- what is your purpose? Before you even consider normality, did you check diagnostics for the other assumptions (like say, correctly specified mean, constant variance, adequate modelling of dependence structure)? – Glen_b Dec 11 '14 at 10:10
  • 2
    Strat by reading [this](http://stackoverflow.com/questions/7781798/seeing-if-data-is-normally-distributed-in-r/7788452#7788452) – David Arenburg Dec 11 '14 at 10:50
  • 3
    Perhaps the most relevant thread on CV for this is ["Is normality testing essentially useless?"](http://stats.stackexchange.com/questions/2492/is-normality-testing-essentially-useless) - testing probably isn't really what you want to do be doing if what you are concerned with is whether the fit is "good enough for practical purposes" rather than "exactly normal". – Silverfish Dec 17 '14 at 13:45

1 Answers1

4

With a sample size that large, I'd just ignore the normality assumptions, not least because normality statistics--including SW--are sensitive to sample size. You could inspect the QQ plot (which as you say, looks fine) or the histogram, but I find it difficult to trust my own eyes (or others' for that matter). You could also inspect skewness and kurtosis statistics, using that standard rules of thumb, but those are a little flaky too. Basically, I wouldn't worry too much.

Jon
  • 368
  • 1
  • 7