7

I'm following an example from the book "R by Example", where they talk about two-way ANOVA.

The database used in poison. The analysis is:

L <- aov(Time ~ Poison * Treatment, data = poison)

Further on, the book says:

The residual plots suggest a reciprocal transformation of the response (poison survival time) (The dependent variableTime)...

That is, a more appropriate variable would be 1/Time.

Here is the residual plot, using plot(L):

enter image description here

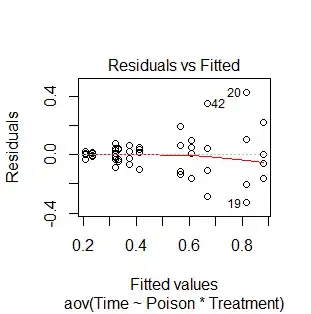
I guess that the reciprocal relationship is evident by the gradually increasing residuals. Why is this correct?

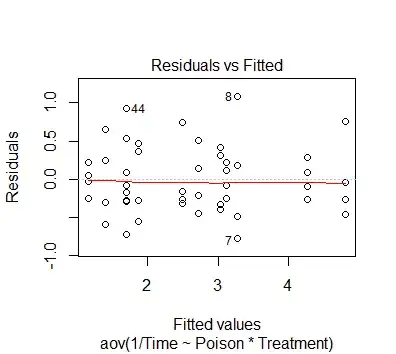
When making the reciprocal model using L <- aov(1/Time ~ Poison * Treatment, data = poison), the residual plot no longer has this property:

enter image description here

So my questions is how could I've known that the special pattern in the first residual plot suggests a reciprocal relationship?

amoeba
  • 93,463
  • 28
  • 275
  • 317
Gimelist
  • 579
  • 6
  • 17
  • 3
    Use a spread-vs.-level plot. I explain and illustrate their use at http://stats.stackexchange.com/a/74594/919 and you can find more about them by [searching our site](http://stats.stackexchange.com/search?q=spread+level+transform). With a little practice one can eyeball a residuals vs. fitted plot and imagine the resulting spread-vs.-level plot (although many people have been fooled by the visual variation that occurs when residuals are clustered within horizontal bands). – whuber Dec 09 '14 at 20:01

1 Answers1

2

To address your question directly, the key is in the increasing scatter to the right in your first image. This essentially showing you that as fitted values increase the spread of residuals also increase. This means your data is heteroscedastic. As a rule-of-thumb, a cone opening to the right, you transform with a reciprocal. That is likely why the author states a reciprocal relationship.

That said, the comment by whuber is still very relevant and looking at spread-vs-level plots would be valuable. Over time you become more familiar with distributions and their meanings.

cdeterman
  • 4,543
  • 1
  • 20
  • 34
  • This rule of thumb is too limited and would seem to contradict equally valid (and limited) rules such as to use a log transform when observing such a "cone." In fact, if the residual plot shows a *true* cone, implying the spread-vs-level plot is linear, then the log is the correct transformation to use, not the reciprocal. The reciprocal is indicated when the spread increases *quadratically* with the level. – whuber Dec 09 '14 at 22:55
  • @whuber, thank you for your additional points. I am just posting what I have read, such as [Hair et. al.](http://books.google.com/books/about/Multivariate_Data_Analysis.html?id=JlRaAAAAYAAJ) where it states this recommendation as well. In no way do I mean to say that the user should just use the reciprocal and be done. – cdeterman Dec 10 '14 at 13:26