1

enter image description here

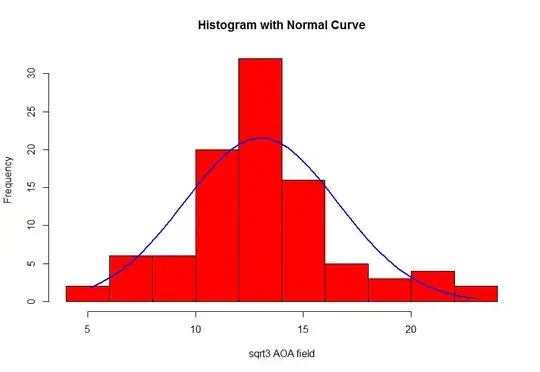
This is the graph of my variable after the $\sqrt[3]{x}$-transformation. After the transformation, I ran a Shapiro test and obtained a $p$-value of $0.004262$. Is it possible my transformed variable is normally distributed? The size of my dataset is 240 samples.

The summary is:

 Sample           Time         Treatment 
 Min.   :  1.0   Min.   :  0.0   Control:24  
 1st Qu.:112.8   1st Qu.:  7.0   TBCZ_x1:24  
 Median :180.5   Median : 24.5   TBCZ_x2:24  
 Mean   :193.2   Mean   : 38.5   TBCZ_x5:24  
 3rd Qu.:312.2   3rd Qu.: 70.0               
 Max.   :360.0   Max.   :105.0  
sqrt_AOA_field   sqrt4_AOA_field  sqrt3_AOA_field 
 Min.   : 11.63   Min.   : 3.410   Min.   : 5.133  
 1st Qu.: 37.90   1st Qu.: 6.156   1st Qu.:11.282  
 Median : 45.42   Median : 6.739   Median :12.730  
 Mean   : 48.30   Mean   : 6.809   Mean   :13.026  
 3rd Qu.: 54.95   3rd Qu.: 7.413   3rd Qu.:14.453  
 Max.   :110.45   Max.   :10.510   Max.   :23.021  

If you need other information write me here. Thanks so much Jo

COOLSerdash
  • 25,317
  • 8
  • 73
  • 123
Giorgia
  • 53
  • 1
  • 8
  • 1
    Please add at least some information about the variable and the problem. Why do you think your dataset has to be normally distributed in the first place? Even if the $p$-value from the Shapiro-test would be $>0.05$ (or some other $\alpha$) this does *not* mean that your data is normally distributed (or any other specific distribution; e.g. see [here](http://stats.stackexchange.com/a/58241/21054)). It would merely mean that you data is compatible/consistent with a normal distribution. – COOLSerdash Dec 06 '14 at 09:46
  • 1
    Hint: look at the results of calculating kurtosis or any equivalent measure of peakedness or tail weight. That's why you're getting that P-value. But I can't see any reason not to use this variable as it is now is. It might even be acceptable untransformed. Depending on what you are doing, normality or not could be irrelevant or unproblematic. – Nick Cox Dec 06 '14 at 10:22
  • 3
    Statistics terminology: You have **one** sample with a size of 240. Terminology in several sciences: you have several samples (of soil, blood, whatever). – Nick Cox Dec 06 '14 at 10:24
  • @NickCox my datase is composed of abundance of a gene (DNA was extracted by soil). My dataset is composed of 240 samples in total and two variables. I tried the normality test because after I would to apply the ANOVA. – Giorgia Dec 07 '14 at 10:53
  • This is the summary of my variable (Y) without transformation (orginal data): summary(TBCZ$AOA_field) Min. 1st Qu. Median Mean 3rd Qu. Max. 135.2 1436.0 2063.0 2719.0 3019.0 12200.0 – Giorgia Dec 07 '14 at 11:00
  • My dataset had one varible (y, in my case is the abundance of the gene) and two factor (x, time and treatment). – Giorgia Dec 07 '14 at 11:04
  • ANOVA works best when conditional distributions are normal; you are focusing on the marginal distribution. – Nick Cox Dec 07 '14 at 14:00

1 Answers1

1

Assuming that your transformed data resembles normal distribution and the fact that cube root is relatively strong transformation, usually applied to right skewed data (http://fmwww.bc.edu/repec/bocode/t/transint.html), I would argue that it's unlikely that your original data is normal.

Having said that, it should be easy to verify that by simply determining skewness and kurtosis of the original data set (you can use psych, e1071, moments or other R packages) and using normality heuristics for the corresponding ranges. You can also generate a Q-Q plot for the original data to visualize univariate normality or Mahalanobis distance Q-Q plot for multivariate normality.

Finally, I agree with @Nick Cox about "the size of my dataset" phrase. Even if your subject domain terminology uses "sample" as main term, following the statistical terminology perspective, I would re-formulate your statement as follows: "the sample size of my data set is 240 [observations]".

Aleksandr Blekh
  • 7,867
  • 2
  • 27
  • 93
  • 1
    The question does not ask about the distribution of the original data, only about the distribution of the transformed data. – whuber Dec 06 '14 at 18:44
  • @whuber: Thank you for letting me know - I guess, I missed that point in the question. However, regardless of that, I believe that my answer is still valid (skipping the first sentence), as it's applicable to either original, or the transformed data. – Aleksandr Blekh Dec 07 '14 at 02:54