I have two continuous predictors ($x_1, x_2$) in my data set and a continuous response variable $y$. The data set is by date for 6 quarters. Since I observed a clear pattern of surge during weekday vs. weekend, I created a dummy variable ($x_3$) like an on.off switch with 0.50 if it is Saturday / Sunday and 1 otherwise. The $x_1$ and $x_2$ in my data have two easily separable levels - meaning low on weekends and regular on weekdays.
The model specification i was trying out is: $log(y) = \alpha + \beta x_1x_3 + \beta x_2x_3 + \epsilon $
First Question: Is the dummy variable a good idea? or Should I make separate models. My objective is to predict $y$ as accurately as possible.
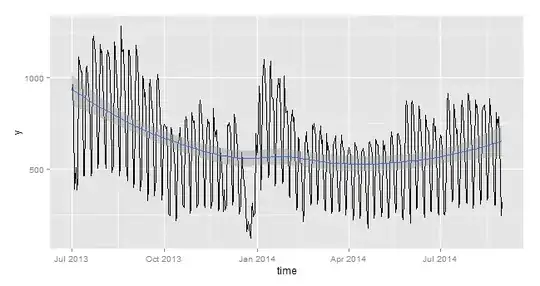
Second Question: When I checked my MAPE and preidcted values based on above fit, I realized the following: I am under-predicting always for Quarter 3 and over predicting for Q4 and Q1. This points to some kind of seasonality. How can I accomodate this in the model?
Third Question: Public Holidays are other days when the model is over-predicting $y-hat$ by huge % but $y$ slumps precipitously. Is it a good idea to remove these days from my model set?
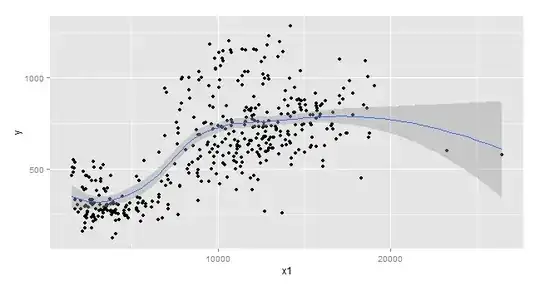
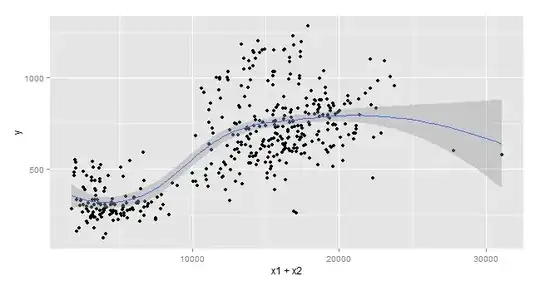
Given below are scatter plots and y plotted against time of my data set: