1

This is a simple question but I am new regression analysis.

If my regression model is of the specification,

$\ln(y) = \alpha + \beta_1 X_1^2 + \beta_2 X_2^2 + \epsilon $,

and I have estimated the $\beta_1, \beta_2, \alpha$ values, how can I predict the $y$ values on the original scale?

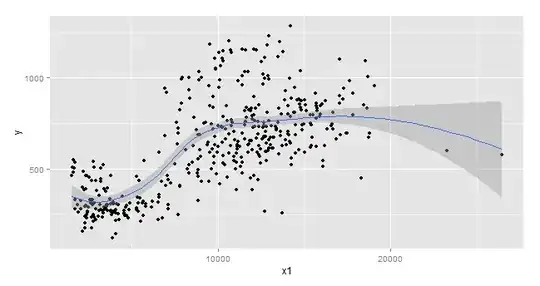
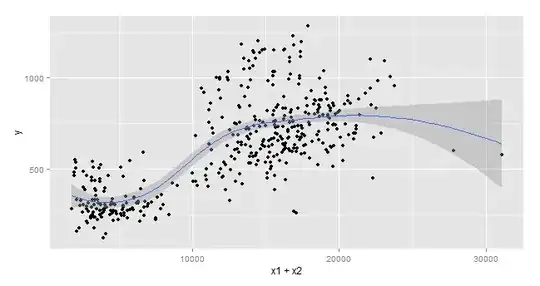
Here are the scatter plots: enter image description here

enter image description here

enter image description here

Here is $y$ plotted against time: enter image description here

thanks.

vagabond
  • 375
  • 1
  • 2
  • 14
  • anyone else agree with me it is a ill-proposed question? – Zhanxiong Nov 20 '14 at 04:35
  • Do you mean that you have estimated $\beta_1$, $\beta_2$, and $\alpha$ using OLS and you want to predict expected $y$ given some $X_1$ and $X_2$ on the *original*, non-logged scale? – dimitriy Nov 20 '14 at 04:37
  • @DimitriyV.Masterov Yes , that is correct. I will edit my question to make it clearer. Thanks ! – vagabond Nov 20 '14 at 04:38
  • 4
    The plots show the model can be substantially improved in some simple ways. Since $X_2$ provides complete separation of two groups, each with strongly differing vertical spreads, consider fitting two separate models depending on the value of $X_2$. For the lower values of $X_2$ there is evidence of strong nonlinearity which could be captured in various simple ways, depending on why you are performing this regression (prediction? explanation? exploration?) and on what any underlying theories might suggest. – whuber Nov 21 '14 at 15:50
  • Thanks @whuber ! That's immensely helpful . . all the X2 lower values are actually weekends and it is the same story with X1 also. Would you suggest I make two models then - weekday / weekend? The purpose of the model is prediction and explanation. Also, I was introducing a constant / dummy variable like an on/off switch for the weekends . There are several other diagnostics I have based on the distribution of MAPE from the predicted values I have from the first iteration of fitting the model. – vagabond Nov 21 '14 at 16:26
  • 1
    Since this turns out to be time series data, you might want to add a plot of y against time. – dimitriy Nov 21 '14 at 16:53
  • i've added y plotted against time. – vagabond Nov 21 '14 at 18:20
  • I've posted more clearly here: http://stats.stackexchange.com/questions/124998/improving-a-regression-model-based-on-diagnostics – vagabond Nov 21 '14 at 18:35

2 Answers2

3

Take a look here for 2 possible approaches. These predictions will reduce the retransformation bias that arises when predictions of the log dependent variable are exponentiated. This will improve the mean prediction, but does not ensure that predictions for individual cases are very good.

As an alternative, fit the model with glm or robust poisson regression.

Edit: Since it turn out you have time series data, this advice is no longer appropriate.

dimitriy
  • 31,081
  • 5
  • 63
  • 138
  • Here's the thing - a simple lm(log(y) ~ x1 + x2) actually gives me a higher r-squared and a marginally better (more random) residual distribution. However the significance of x2 gets diminished to 0.01 which is acceptable by convention of 0.05 and lower. However with lm(log(y) ~ x1^2 + x2^2) , i trade off on r-squared and residual distribution, but significance of x2 gains a lot. Considering that in the real world, I think X2 is equally or more significant than x1, I believe the second model is the better choice for me. But obviously there are gaps in my understanding . . . – vagabond Nov 20 '14 at 05:21
  • I would include both $x$ and $x^2$. This has come up before many times on CV. – dimitriy Nov 20 '14 at 05:28
  • are you suggesting this formula : lm(log(y) ~ x1 + x2 + x1^2 + x2^2, data = data.frame) ? When I do this, significance codes for everything except x1 goes downhill i.e. x2, x1^2 and x2^2 - none of them are significant anymore ! – vagabond Nov 20 '14 at 05:36
  • Can you post your data or at least a scatter plot matrix of it? Also describe it. – dimitriy Nov 20 '14 at 06:24
  • Also, the marginal effect of $x$ where you have $\beta_1 x + \beta_2 x^2$ in the model is $\beta_1 + 2 \cdot \beta_2 \cdot x$. Arguably, you would want to consider the significance of that rather than focusing on the individual coefficients. – dimitriy Nov 20 '14 at 22:16
  • 2
    It is almost meaningless to compare $R^2$ for a regression of $Y$ to one of $\log(Y)$. Unless you have a theory that strongly predicts the model you have proposed, you should back off and start over with a more controlled approach to model identification and fitting. Since you're new to regression, maybe it's time to read a textbook? – whuber Nov 21 '14 at 15:52
  • This is not the model I have definitively proposed. I was more curious about how the equation needs to be solved. Based on the above plots, I've tested a quadratic, linear, logarithmic and exponential functions. I need help with controlling the weekend anomaly and other things like quarterly seasonality. Q3 of my data is different from Q4. Seasonality is affecting y but I dont know how I can capture that as a predictor. – vagabond Nov 21 '14 at 17:14
  • I've posted the question more clearly here: http://stats.stackexchange.com/questions/124998/improving-a-regression-model-based-on-diagnostics – vagabond Nov 21 '14 at 18:36
  • herc.research.va.gov link has erroded – CrunchyTopping Sep 24 '19 at 18:47
  • 1
    @CrunchyTopping I was able to fix the link using Wayback Machine. – dimitriy Sep 24 '19 at 18:51
2

There's very strong structure in the time domain that you shouldn't ignore - a very distinct weekly cycle. That accounts for a lot of the variation. There's also longer term variation.

There's also an obvious calendar effects (holiday effects). One simple way to model these is with dummy variables.

Once your model incorporates these (especially the strong weekly cycle), the relationships with the X's will likely change quite a bit.

A quite useful reference on basic forecasting is the online book by Hyndman and Athana­sopou­los.

Glen_b
  • 257,508
  • 32
  • 553
  • 939