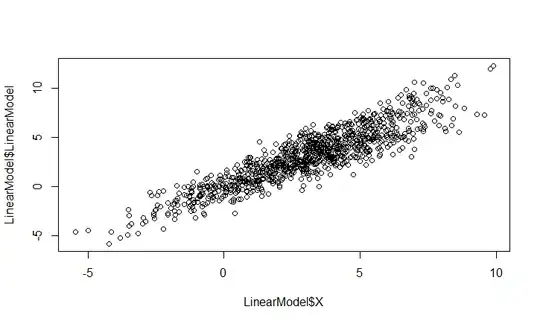
Above are three plots of the Linear model I am trying to analyze. The first one is a basic plot of the linear data:
LinearModel = read.csv(file= "C:/Users/Nikhil/Documents/LinearModelCase2.csv",
                       header=TRUE, sep=",")
plot(LinearModel$X,LinearModel$LinearModel)
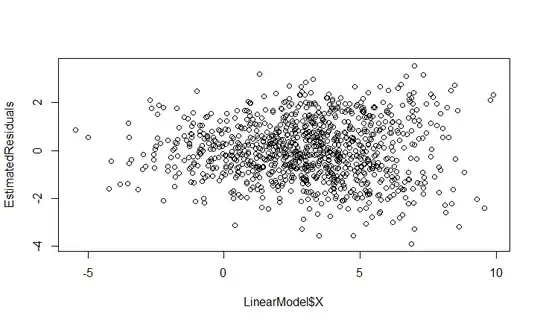
The second one is plot of the residuals (error values) based on the estimated linear model using the given data:
EstimatedLinearModel <- lm(LinearModel$LinearModel~LinearModel$X)
EstimatedResiduals   <- EstimatedLinearModel$residuals
plot(LinearModel$X,EstimatedResiduals)
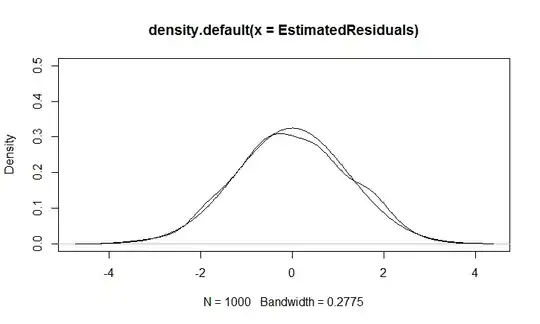
The third is a plot of the probability density function of the residuals using this code:
Probability.Density.Residuals <- density(EstimatedResiduals)
plot(Probability.Density.Residuals, ylim=c(0,.5))
lines(Probability.Density.Residuals$x,
  dnorm(Probability.Density.Residuals$x, mean=mean(EstimatedResiduals),
            sd=sd(EstimatedResiduals)))
To me the linear model looks like a mix of two or more different linear models. If this is the case how do I go about separating the two or more linear models using R?
Please let me know if this question does not make any sense, I am new to R and statistics.