2

There is a univariate mean: sum the points and divide by the count.

There is a multivariate mean analog - the centroid, a point in a multidimensional space. (1).

For the median one sorts the list and picks the middle element. If the middle element doesn't exist, the nearest values to it are averaged. (2) It is an ordered statistic.

If I were to make a cloud of points in 2d space, then median might depend on what I defined as an axis. If my cloud was more like a needle, then median might vary greatly with very slight changes in semi-minor axis, because it could flip from one tip to another of the cloud.

Is there a generalized geometric analog of the mean - something that uses an analog of an ordered statistic in a non-univariate space? If I had well behaved cloud, even if it was more needle-like, I would expect such a median to have a reasonable correlation with and proximity to a centroid.

It was suggested that this (link) contains the answer. When I try to find the point that gives the least typical distance, the results are consistent with a geometric mean.

#CODE
n <- 1000
xmin <- 0
xmax <- 10
ymin <- 0
ymax <- 10

#make some points
x <- runif(n,min=xmin,max=xmax)
y <- runif(n,min=ymin,max=ymax)

#plot
plot(x,y,type="p")

#find "geometric median"
mu <- 0

for (i in 1:n){

  xp <- x[i]
  yp <- y[i]
  d <- sqrt( (x-xp)^2 + (y-yp)^2 )
  mu[i] <- mean(d)

}

idx <- which(mu==min(mu),arr.ind=true)

points(x[idx],y[idx],col="Red",pch=16)
points(mean(x),mean(y),col="Blue",pch=17)

I get plots that look like the following. The red point is the "idx" of the least typical distance to all other points. The blue triangle is the centroid. The red circle is the "geometric median".

enter image description here

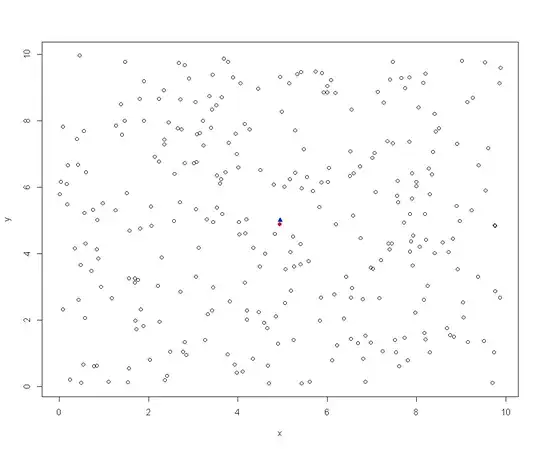
To me the image seems to confirm that the approach to the median is consistent with the mean. I have not accounted for an odd number of points, but I think that using uniform random and an $$ L_2 $$ norm is unlikely to give me two candidate medians with the same distance to all other points.

So I tried to determine the error in the estimate of the median from the true center as a function of sample size. I wanted to make sure that I have acceptable sample sizes for my intended end-use of this approach. I repeated the test ~3000 times per sample size setting and chose the median distance as representative. In general the results for repeated tests to find the median on ~3000 runs had variation only in the 3d decimal place.

Here is the table of values of distance from the true center as a function of sample size.

samples err
10  2.008
15  1.676
20  1.456
25  1.317
30  1.198
35  1.124
50  0.930
90  0.698
100 0.659
300 0.386

I used Eureqa to try and determine the analytic form that is best described by the fit. It looks like the following is the appropriate model. AIC gives it as a decent candidate.

$$ Err(n) = \frac {6.5}{\sqrt{n}}$$

The domain is between 0 and 10 in x and y. The value $ n $ is the number of samples. Err is the distance between the median median and the true center.

Questions:

  • Can you confirm/reject that the general approach is correct based on the consistency between the median and the mean as a result from the code?
  • Is the general form as spoken ground-up from the numbers as opposed to top-down by theory consistent with the textbook results from what the theory says it should be? What is the appropriate expression there and how should it be derived?
  • The denominator is expected, but where does the 6.5 in the numerator come from? If my domain were a cube or a hypercube what should I expect of the numerator?

References and suggestions are always welcome.

EngrStudent
  • 8,232
  • 2
  • 29
  • 82
  • 1
    Other closely related questions can be found with a search: http://stats.stackexchange.com/search?tab=votes&q=multivariate%20median%20is%3aquestion. – whuber Oct 15 '14 at 19:11
  • 1
    The first gives the description, but no code. http://stats.stackexchange.com/questions/43009/what-are-the-multidimensional-versions-of-median – EngrStudent Oct 15 '14 at 19:21
  • 2
    The duplicate gives many solutions, formulas (which are readily translated into code), and references (which can be used to hunt down code). Because we are not a "where is code for ..." site, your remaining request for `R` code would not be considered on topic. – whuber Oct 15 '14 at 19:25
  • 1
    And the simple example of the use? Off topic as well? – EngrStudent Oct 15 '14 at 19:29
  • That would be on topic. I did a quick search of the site for such examples but found none. – whuber Oct 15 '14 at 19:38
  • There is still an error in the code: it does not compute the geometric median; it merely identifies one value from the dataset which minimizes the mean distance to all the data. A true geometric median typically is a location that is not in the dataset at all. Using 1000 uniformly distributed points for your study will not help much in understanding what's going on, either: work with much fewer so you can *see* the variation. – whuber Oct 16 '14 at 15:27
  • For an odd number of elements in 1d data, the median is an element of the set. If I used gradient descent then in higher dimensions this is going to run into a wall. GD doesn't like dimensionality. Isn't it against the rules to not, most of the time, pick an element of the set for ordered statistics? – EngrStudent Oct 16 '14 at 16:11
  • 1
    There are no "rules," but what you are computing is not the geometric median. In many circumstances--even with 1000 points--it won't even be close to the geometric median. (All it takes is for a "bubble" to occur near the center of the point cloud: the geometric median will lie within that bubble relatively far from any of the data points. Bubbles are common in realizations of uniform spatial distributions.) Thus your simulations aren't going to reveal anything reliable about the geometric median *per se*. – whuber Oct 16 '14 at 16:13
  • What happens if the x-axis values are the slopes for all pairs of points in a Theil-Sen slope computation on a cloud of points, and the y-axis values are the computed y-intercepts? There is an actual point with "best" distance "cost" - it is one model in the set. I could compute a geometric median in the space - but it was not one of the candidates. Isn't a requirement of the estimator that it returns one of the candidate models? – EngrStudent Oct 16 '14 at 17:15
  • You seem to be asking a different question. Are you sure you really want a multivariate analog of a median, then? Also, it is not at all apparent whether the point you describe actually produces an optimal regression procedure, for two reasons. First, it limits the solution to one of the lines actually passing through two data points. Second, it (strangely) mixes together differences of intercepts and differences of slopes in the calculation, yet slopes and intercepts have no inherent commensurability. – whuber Oct 16 '14 at 17:42
  • I am trying to extend the Theil-Sen estimator to splines. Though it is sometimes called a non-parametric method, it is really "hyper-parametric" where there can be more parameters (total) than points. I expect to be working in a 1000-dimensional space. – EngrStudent Oct 17 '14 at 12:38
  • 1
    Wonderful overview of alternative formulations of the multivariate median: http://cgm.cs.mcgill.ca/~athens/Geometric-Estimators/intro.html – Aditya Dec 26 '17 at 13:35

0 Answers0