I am a rookie on R and on spatstat package. I would like some help with the Kres function on spatstat. As is always wise to plot the residuals from any kind of analysis, I'm having trouble interpreting the residuals plot.
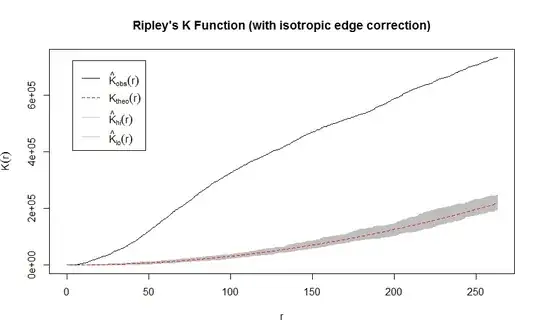
My goal in using this package it is to access the spatial pattern for this data. So, I have some simulate data and I ran the Kest function. As you can see, aggregation in all scales. When I plot the residuals from the analysis, the residual line (with isotropic correction) is it far away from the perfect fit. Should I be concerned about those residuals? If yes, what it is the advice to adjust this problem.
Asked
Active
Viewed 905 times
2
Gabriel
- 3,072
- 1
- 22
- 49
Renzo Ferreira
- 65
- 1
- 5
-
The one-dimensional examples at http://stats.stackexchange.com/a/122816 might help you develop some skills for reading information in these plots. – whuber Dec 13 '14 at 00:26
1 Answers
4
It is difficult to get an impression of which kind of analysis you are doing. If you have simply fitted a model with complete spatial randomness (CSR), a.k.a. a homogeneous Poisson model your result is not surprising. It simply tells you what the difference between the empirical K-function and its expected value under CSR is. It is basically equivalent to K_obs-K_theo from your first plot. Clearly CSR is a very bad model for this dataset. The idea with Kres is that you fit a better model and then run Kres on that to see whether the expected value of K under that model is close to the empirical K.
Ege Rubak
- 1,058
- 5
- 8