I want to browse a .rda file (R dataset). I know about the View(datasetname) command. The default R.app that comes for Mac does not have a very good browser for data (it opens a window in X11). I like the RStudio data browser that opens with the View command. However, it shows only 1000 rows and omits the remaining. (UPDATE: RStudio viewer now shows all rows) Is there a good browser that will show all rows in the data set and that you like/use.
Asked
Active
Viewed 3.3k times
38
Jeromy Anglim
- 42,044
- 23
- 146
- 250
Curious2learn
- 695
- 2
- 6
- 8
7 Answers
26
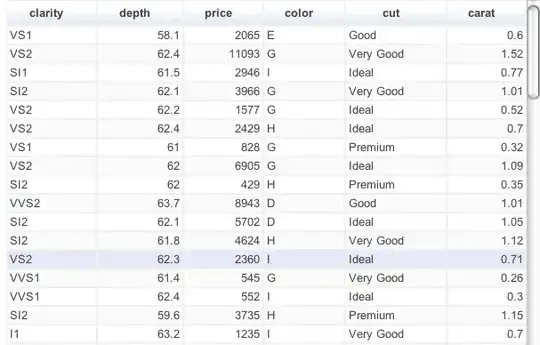
I recommend highly the R Package googleVis, R bindings to the Google Visualization API. The Package authors are Markus Gesmann and Diego de Castillo.
The data frame viewer in googleVis is astonishingly simple to use.
These guys have done great work because googleVis is straightforward to use, though the Google Visualization API is not.
googleVis is available from CRAN.
The function in googleVis for rendering a data frame as a styled HTML table is gvisTable().
Calling this function, passing in an R data frame render R data frames as interactive HTML tables in a form that's both dashboard-quality and functional.
A few features of googleVis/gvisTable i have found particularly good:
to maintain responsiveness as the number of rows increases, user-specified parameter values for pagination (using arrow buttons); if you don't want pagination, you can access rows outside of the view via a scroll bar on the right hand side of the table, according to parameters specified in the gvisTable() function call
column-wise sort by clicking on the column header
the gvisTable call returns HTML, so it's portable, and though i haven't used this feature, the entire table can be styled the way that any HTML table is styled, with CSS (first assigning classes to the relevant selector)
To use, just import the googleVis Package, call gvisTable() passing in your data frame and bind that result (which is a gvis object) to a variable; then call plot on that gvis instance:
library(googleVis)

gvt = gvisTable(DF)

plot(gvt)
You can also pass in a number of parameters, though you do this via a single argument to gvisTable, options, which is an R list, e.g.,
gvt = gvisTable(DF, options=list(page='enable', height=300))
Of course, you can use your own CSS to get any fine-grained styling you wish.
When plot is called on a gvis object, a browser window will open and the table will be will be loaded using Flash
doug
- 9,901
- 1
- 22
- 26
-
3This doesn't seem to work all that well for moderate to large data sets. – Zach Aug 01 '12 at 17:20
22
Here are a few basic options, but like you, I can't say that I'm entirely happy with my current system.
Avoid using the viewer:
- I.e., Use the command line tools to browse the data
headandtailfor showing initial and final rowsstrfor an overview of variable typesdplyr::glimpse()for an overview of variable types of all columns- basic extraction tools like
[,1:5]to show the first five colums - Use a pager to display and navigate the data (e.g.,
page(foo, "print")) possibly in conjunction with some variable extraction tools. This works fairly well on Linux, which usesless. I'm not sure how it goes on Windows or Mac.
Export to spreadsheet software:
- I quite like browsing data in Excel when it's set up as a table. It's easy to sort, filter, and highlight. See here for the function that I use to open a data.frame in a spreadsheet.
Flo
- 159
- 8
Jeromy Anglim
- 42,044
- 23
- 146
- 250
-
(+1) most often I also export to spreadsheets, some times `edit(your_data_object)` is also useful, not sure about limitations in rows and columns for this function though. – Dmitrij Celov Jun 04 '11 at 12:27
-
3(+1) too. The Data Browser in Stata is not perfect but it's one of the reasons why I launch Stata rather than R(Studio) in many circumstances. – Fr. Jun 04 '11 at 15:29
-
1In re: your second bullet, [RExcel](http://en.wikipedia.org/wiki/RExcel) purportedly makes passing data between R and Excel more seamless, though it's only available on Windows. I haven't tried it (I'm not on Windows); I'm basically content with write.csv :) – JMS Jun 04 '11 at 18:17
-
-
-
Thanks for the suggestions. The reason I don't want to export to Excel is that it would make the data file bigger. – Curious2learn Jun 05 '11 at 15:07
-
@Curious2learn Would you run into memory problems if you tried opening your data in Excel (or some other spreadsheet program)? – Jeromy Anglim Jun 05 '11 at 15:16
-
I may not run into memory problems, however, the file will be just too big. I tried to export a 84kb rda file to excel and it became about 5.9MB in size. My final R data set file will be about 10MB. The excel file will be then about 700 MB. That seems like a lot of space to use just for browsing the data and I was hoping for a better solution. – Curious2learn Jun 05 '11 at 15:55
-
2@Curious2learn: are you seriously going to look through 700 Mb of data manually? Most of the options given by Jeromy (`head`, `tail`, `str` etc.) should suffice. If you want a "larger" view of your data... plot it (`plot`, `qqplot`, `hist` etc) – nico Jun 28 '11 at 05:27
13
RStudio (RStudio.org) has a built-in data frame viewer that's pretty good. Luckily it's read-only. RStudio is very easy to install once you've installed a recent version of R. If using Linux first install the r-base package.
Frank Harrell
- 74,029
- 5
- 148
- 322
-
2Yes, I like the viewer in RStudio. However, as I said in my post, it shows only first 1000 rows. Can I increase this by changing some setting. I tried to change max.print, but that did not affect the data viewer. – Curious2learn Jun 05 '11 at 15:09
-
@ Curious2learm: you should ask them to add this option in the next RStudio version on http://support.rstudio.org/help/discussions/suggestions They usually answer within 2 days – RockScience Jun 28 '11 at 04:11
12
Here are some other thoughts (although I am always reluctant to leave Emacs):
- Deducer (with JGR) allows to view a data.frame with a combined variable/data view (à la SPSS).
- J Fox's Rcmdr also offers edit/viewing facilities, although in an X11 environment.
- J Verzani's Poor Man Gui (pmg) only allows for quick preview for data.frame and other R objects. Don't know much about Rattle capabilities.
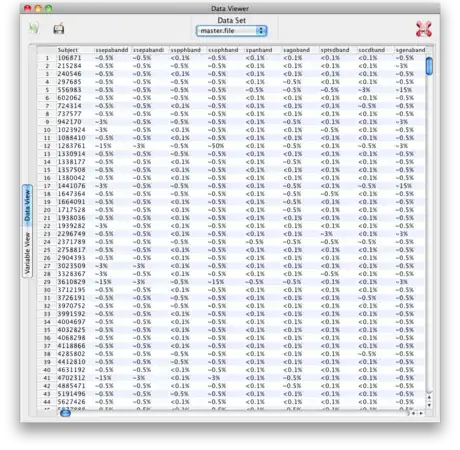
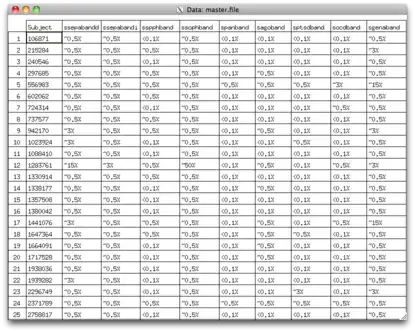
Below are two screenshots when viewing a 704 by 348 data.frame (loaded as an RData) with Deducer (top) and Rcmdr (bottom).
chl
- 50,972
- 18
- 205
- 364
9
You can get View() to display all of your data in RStudio. The trick is that you need to use the command syntax utils::View() instead. (For slightly more information, see my answer on Stack Overflow here: R View() does not display all columns of data frame.)
gung - Reinstate Monica
- 132,789
- 81
- 357
- 650
-
I wrote a simple function using the utils::View() function that also shows me the column numbers and put it in the [Rprofile.site file] (http://www.statmethods.net/interface/customizing.html) so that the function is loaded on R startup. The best part is that row numbers and column names are always visible. Here is the code for the function: `view – elevendollar Jan 30 '15 at 15:16
3
Recently I started to keep the data in a sqlite database, access the database directly from R using sqldf and view / edit with a database tool named tksqlite
Another option is to export the data and view / edit with Google Refine
Karsten W.
- 667
- 6
- 25
-
Thanks for the information. I will figure out how to export the data to Google Refine and see if that works well. – Curious2learn Jun 05 '11 at 18:36
-
1Another very neat tool for viewing or editing data in sqlite databases is http://sqlitebrowser.org/ – Dominic Comtois Nov 25 '14 at 05:47
0
The datatable function from DT package creates HTML tables. You can nicely view wide tables.
Edgar Santos
- 273
- 2
- 9