How do you construct ROC Curves when there are more than two outcome categories (in my case, I have four)? I've heard you should do this for the most popular group. Are there any other ideas? Are there functions in R to help with this?
Asked
Active
Viewed 1.4k times
3
-
1Do you mean how to construct ROC's when there are +2 **models**? – Aug 18 '14 at 21:23
-
Or do you mean that there are 4 outcome categories? – gung - Reinstate Monica Aug 18 '14 at 21:46
-
Categories :) I edited my post – Marcin Kosiński Aug 18 '14 at 21:51
-
I would suggest checking out this answer: http://stats.stackexchange.com/questions/38541/creating-roc-curve-for-multi-level-logistic-regression-model-in-r – Aug 18 '14 at 21:58
-
4What about ROC curves makes them insightful to you? Are you really interested in concordance probabilities ($c$-index; ROC area; pure discrimination measure)? I find the ROC area to be helpful even though the curves are not helpful to me. And you can generalize the idea of concordance probability to multiple categories using Somers' $D_{xy}$ rank correlation coefficient. – Frank Harrell Aug 18 '14 at 21:59
-
Nice one @FrankHarrell . ROC Curves are a great way to visualize how good are your classifiers if you put many of them on 1 plot :) – Marcin Kosiński Aug 18 '14 at 22:25
-
How does that give you any insight? – Frank Harrell Aug 19 '14 at 03:23
-
The Higher the Curve is, the better the classifier is – Marcin Kosiński Aug 19 '14 at 08:07
-
How does the area under the curve not capture that? – Frank Harrell Aug 19 '14 at 23:08
-
It does not capture the situation You chociaz the cut argument. Even the AUC is Higher from one Curve it does not mean there exists an argument from lover-auc Curve that Give Higher value of ROC Curve :p I think it's how's more than AUC. But it might be only my opinion. – Marcin Kosiński Aug 19 '14 at 23:14
-
I haven't seen an example yet where someone viewed an ROC curve and it led to an action that was both useful and correct. – Frank Harrell Aug 20 '14 at 18:00
2 Answers
7
Several ideas and references are discussed in:
- A simple generalization of the area under the ROC curve to multiple class classification problems.
- Multi-class ROC (a tutorial) (using "volumes" under ROC)
Other approaches include computing
- macro-average ROC curves (average per class in a 1-vs-all fashion)
- micro-averaged ROC curves (consider all positives and negatives together as single class)
You can see examples in some libraries like scikit-learn.
See also this other thread in CrossValidated: How to compute precision/recall for multiclass-multilabel classification?
-
-
-
@Josh that's the vast and outstanding piece of literature :) Thank you very much. That was something I was looking for! CV is a great place. – Marcin Kosiński Aug 18 '14 at 22:28
2
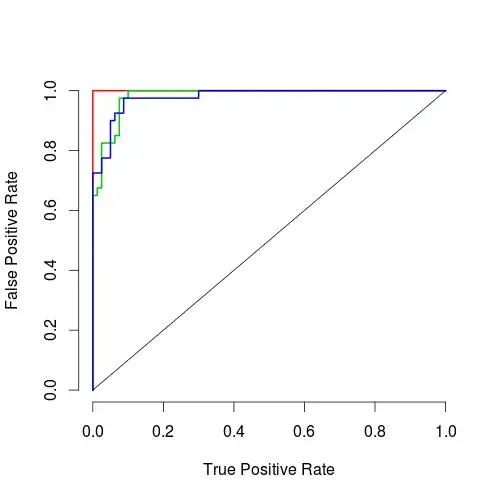
One of the ideas is to use one-vs-all classifier. This answer gives move information about it, including some R code.
Here's a plot from that answer
Alexey Grigorev
- 8,147
- 3
- 26
- 39