How to transform a normal random variable such that I can simulate normal samples between the range of 1 and 45?
Do I need to do a jacobian transformation ?
How to transform a normal random variable such that I can simulate normal samples between the range of 1 and 45?
Do I need to do a jacobian transformation ?
Any normal distribution is defined on the entire real line $(-\infty,\infty)$.
This means that while we can choose some probability of being between 1 and 45, you can't have it both be actually normal and definitely in that range.
You have to decide which of the two of those can be compromised.
However, it also sounds like perhaps you're after an integer result; if that's so, that, again, means you don't have normality, and have to compromise one or the other.
Are you after a distribution with mean 23 ($\frac{_{45+1}}{^2}$)?
Can you say any more about the situation?
Whoever asked you to do this seems to be operating under a misunderstanding because the conditions are inconsistent.
I have no idea how to choose the variance parameter.
The smaller the variance, the less chance of going outside the range. But the smaller the variance, the less chance of taking up most of the range.
For example, if you choose $\sigma=5$, you'll have about 11 of your 1000 samples with at least one value outside the bounds, but on the other hand, most of the time you won't have any values very close to 1 or 45.
You can use simulation to judge the tradeoff.
Here's a simulated distribution of the largest observation for n=1000 with mean 23 and sd 5:
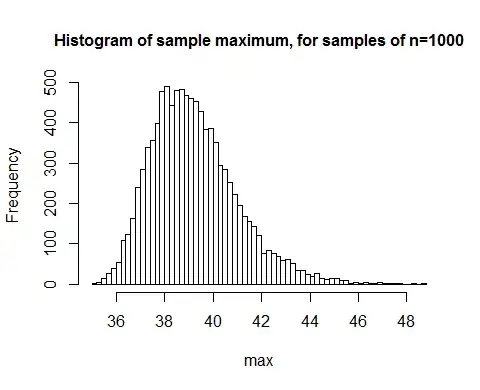
As you see almost all of the time, it's less than 45 but then often it's less than 40.
One possibility is to truncate the normal; e.g. try mean 45 sd around 6 (say) and then regenerate values that fall outside the range (or generate slightly too many and then omit what you don't need).
Here's an example with sd=6 and another with sd=9:
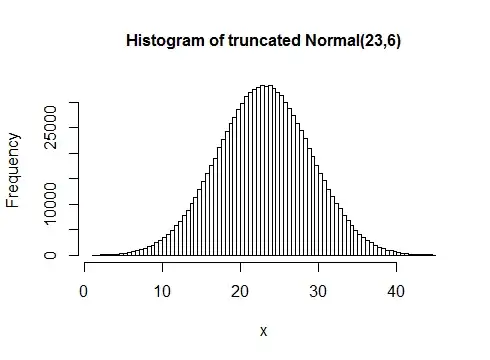
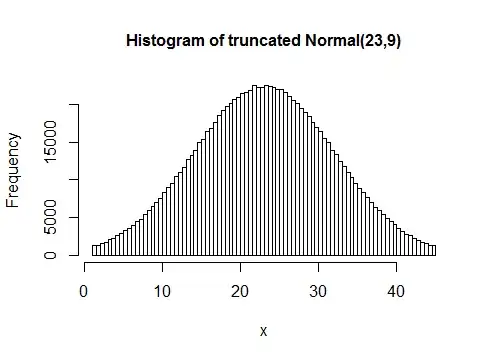
(This is not a single sample of 1000, but many samples of 1000 so you can see the distribution)
The narrower one looks more normal but you're less likely to get values near 1 or 45; the wider one is a little less normal looking but generally gives values right out near the ends.
You may want to choose something in between.
Another possibility: the person may actually want you to fit it to 1 to 45 post-hoc (that is to make the smallest value 1 and the largest 45). This is fine, but you don't actually have normality any more (though with n=1000 it will look very close).
For example, here's what happens when you use this strategy with n=6 instead of n=1000:
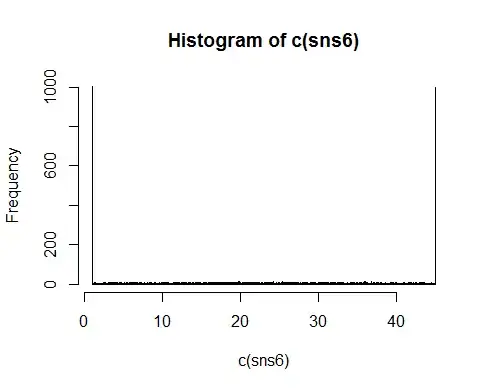
(1000 samples of n=6)
There are spikes at 1 and 45 because those values are certain to occur, but leaving that aside, the distribution of values in between 1 and 45 is fairly flat, only gently bulging in the center. [Macro makes a similar point about the n=4 case here; it's even more nearly flat, though even the n=3 case still shows a slight bulge in the center.]
For small samples this isn't much use. As sample sizes increase, this improves. Here it is for samples of size 100:
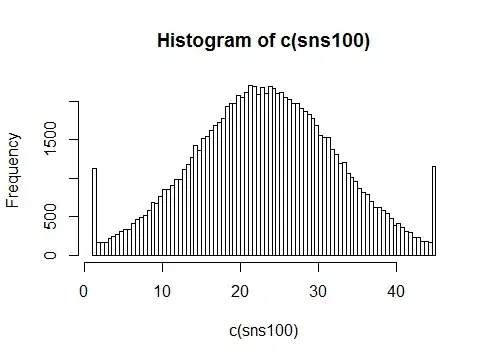
(1000 samples of n=100)
It looks like a Winsorized normal (or ignoring the endpoints, it's like a truncated normal). This will still be having an impact at n=1000:
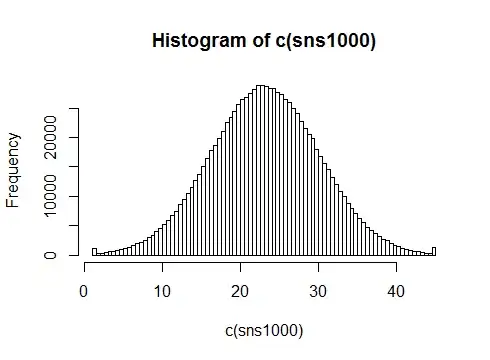
Note that this isn't a single sample, but 1000 samples of 1000. I did that to show you what the actual distribution you're ending up with is like.
I think you're better off with a truncated normal than doing this. Nevertheless, if this is what they want, it is very easy to do.
How about just sampling 1000 from the standard normal distribution and then scaling the outcome to [1,45] by 44*(x - min(x))/(max(x)-min(x))+1.