The equation is a general form for the broad class of densities in the exponential family (i.e. that's the pdf).
If it's the distribution for y corresponding to a fixed $x_i$, is it possible that even if the plot of $y$ against $x$ looks like a straight line, I should still use GLM instead of simple regression?
The equation for the conditional density is unrelated to the form of the relationship between $y$ and $x$. It is perfectly possible to fit a linear function (via the identity link) with an exponential family conditional density. Which is to say, yes, you can still use GLMs when it's a straight line. Indeed the Gaussian is in the exponential family, so you can still do regression there also.
e.g. here's a straight line fit with a Gamma response:
> summary(glm(dist~speed,cars,family=Gamma(link=identity)))

Call:
glm(formula = dist ~ speed, family = Gamma(link = identity),
    data = cars)

Deviance Residuals:
     Min        1Q    Median        3Q       Max
-1.07986  -0.29703  -0.06053   0.22879   0.87150

Coefficients:
            Estimate Std. Error t value Pr(>|t|)
(Intercept)  -7.5843     2.1292  -3.562 0.000843 ***
speed         3.2106     0.2556  12.563  < 2e-16 ***
---
Signif. codes:  0 ‘***’ 0.001 ‘**’ 0.01 ‘*’ 0.05 ‘.’ 0.1 ‘ ’ 1

(Dispersion parameter for Gamma family taken to be 0.1617597)

    Null deviance: 22.4827  on 49  degrees of freedom
Residual deviance:  8.0945  on 48  degrees of freedom
AIC: 411.79

Number of Fisher Scoring iterations: 8
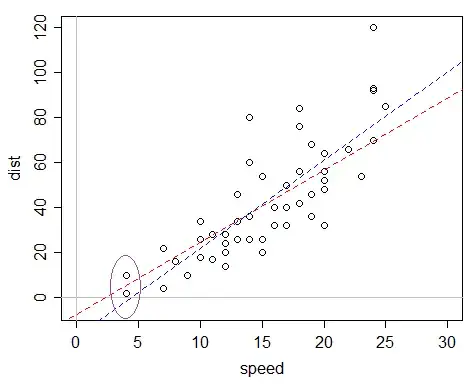
The Gamma linear fit is in red, the least squares fit is in blue. See the discussion here as to why a gamma model, even with identity link is better in this case (essentially, none of the fitted stopping distances are negative). It's still less than perfect (it suggests a 0 and then negative stopping distance at a positive speed), but its fit is at least plausible within the range of $x$ values we actually have, which is a very useful property to have.
(Of course, even better would be to fit a more plausible model.)
The book suggests that when assuming response y follows a gamma distribution, it is a common practise to use a logarithmic link function.
In insurance and many other financial applications certainly. Partly that's because the relationships involving things like money tend to be multiplicative, and are broadly understood in that form.
I made a histogram of y (with frequency on y-axis) and it looks like a gamma curve fits well.
It may look like that, but it's not necessarily very meaningful, and doesn't relate to the assumption.
Does that essentially imply that I should choose f(y) to be gamma?
I kinda doubt it because I suppose yi|X=xi and Y are essentially two different things.
You're correct to doubt it. It's the conditional distribution that's assumed to be gamma.
If $y$ depends on $x$, the unconditional distribution of $y$ will be a mixture of those conditional distributions and may not be meaningful. It could look completely different from gamma; a different pattern of $x$ values could change the y-histogram dramatically, while leaving the conditional distributions unchanged.