I have a dataset of order processing with 8 million rows with following columns:
HistoryId- Identity column of the recordsItemId- Id of the item trackedPrevious status- status of Item before the history record createdNew status- status of Item when history record createdTime till status change- The time difference between the previous record of the item till this history record created.
I want to visualized the these data with a graph / chart that displays the flow similar to this:
Status 1 --> Status 2 --> Status 3 --> Status 4 --> Status 5
                                       Status 5
                          Status 4 --> Status 5
Status 2 --> Status 3 --> Status 5 --> Status 2 --> Status 4 --> Status 5
                                                    Status 5
                      --> Status 4 --> Status 5
             Status 4 --> Status 5
In example above - assume that all of the items have:
- First status is either
Status 1orStatus 2. - All item start with
Status 1have 2nd status isStatus 2, while for item start withStatus 2partiallyStatus 3, and others areStatus 4 - Moving on similar logic of (2.) with break down by each flow.
I want to explore the data and visualize all possible flows of the data. Then summarize them by counting the number of items go through each Status of each flow. Currently, I am doing them manually. Is it possible to automate this and visualize it on graph?
Sample Data:
HistoryID     ItemId     Previous_status     New_Status
1             1          NA                  status_1
2             2          NA                  status_2
3             1          status_1            status_2
4             1          status_3            status_4
5             2          status_1            status_3
6             1          status_4            status_5
7             2          status_3            status_5
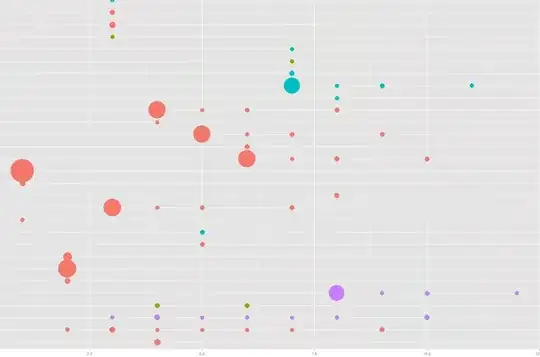
And here is a sample output even this output is not completely what I wanted - Explanation:
X- is the index of status that an Item have in it life cycle.Y- is the status nameSize- the number of item go through status Y at index X.- Skip the color as it was exclude from the data in example.
- As you can see most of item have the status Y as the beginning status (the fist left column).
- Then moving to the right they are breaking down to other status (sometime they may come back the beginning status but in later index)
- The limitation of this is not show the flow by detail even I can see the flow by the changing in size of the point overtime.
- What I really want is something like a decision tree where you can see how item flow through the status, and each flow is separate from each others.
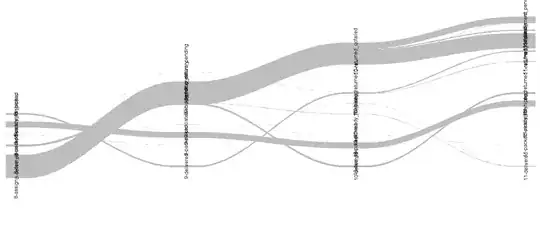
I managed to used the riverplot package. However I have some prolems as image below. Anyone know how to display the lable at the side instead of right on the spots? as I have a about 30 status and it is very confusing when having them display like the image below.
For your reference, here is the link to the package riverplot tutorial