I normally use MATLAB, or JMP but right now am working with R.
I have ~150 dimensional data with a few hundred thousand rows. Some of the columns are non-informative, they only have one value. This makes some of the descendants of "pairs" to fail.
I wish that I could say "pairs(mydata)" but that doesn't work well.
I know a few (~18) higher value variables that I think are more informative so I can, if I like, enter "pairs(mydata[,indices])" and get an 18x18 scatterplot matrix plot. I don't get the nonparametric density on top of them. Can you tell me how to get this?
Now JMP has a switch that allows adding what they call a nonparametric density to scatterplots. (link, link,) I want to do that for my data.
Here are things that I have looked out but they have not been helpful:
- (pairs) http://www.statmethods.net/graphs/scatterplot.html
- (ggpairs) http://www.r-bloggers.com/five-ways-to-visualize-your-pairwise-comparisons/
- http://learnr.wordpress.com/2009/07/15/ggplot2-version-of-figures-in-lattice-multivariate-data-visualization-with-r-part-5/
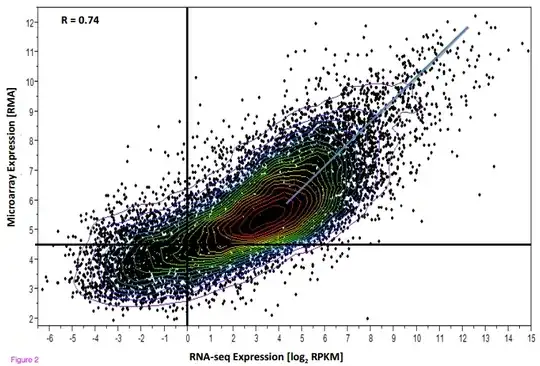
I really want something like this, with my data, as each of the scatterplot panes in the scatterplot matrix: