I have a dataset depicting weekly revenue over time for a computer company. The plot for the data looks like this:
I decomposed the data into its additive components using the decompose function in R and plotted the various components:
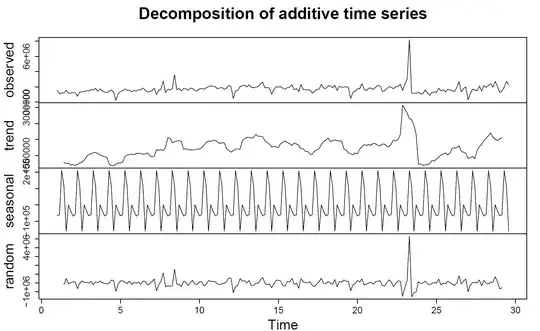
Next I tried removing the seasonal component using the following code:
> RevenueDec <- decompose(Revenue)
> RevenueSeasonallyAdjusted <- Revenue  - RevenueDec$seasonal
However, I still get a seasonal component when I decompose 'RevenueSeasonallyAdjusted':
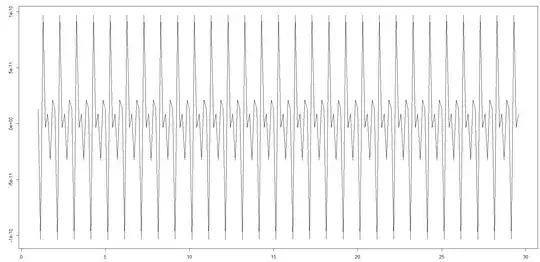
The y-axis has very small values but the seasonality exists nonetheless.
Could you help me out here.
EDIT: In the next step I tried using the auto.arima function on my seasonally adjusted data to get a forecast and got a plot like this:
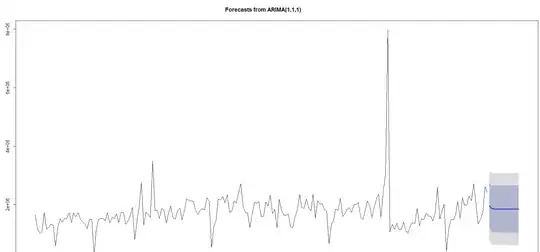
Is this the correct approach to use, or should I try something different?