12

I am a research assistant for a lab (volunteer). I and a small group have been tasked with the data analysis for a set of data pulled from a large study. Unfortunately the data were gathered with an online app of some sort, and it was not programmed to output the data in the most usable form.

The pictures below illustrates the basic problem. I was told that this is called a "Reshape" or "Restructure".

Question: What is the best process for going from Picture 1 to Picture 2 with a large data set with over 10k entries?

This is a sample, the actual file has over 10k entries. I've color coded to help with clarity

This is what it all needs to be converted into.

Wilkoe
  • 139
  • 1
  • 5
  • 1
    Please split this into two separate questions and provide sample data (you can also omit your background unless relevant). Roughly, on (1) you'll want to find a mapping and then merge to attach numbers. (2) depends highly on the type of manipulations you'll want to do; popular R packages for this type of thing include `data.table`, `dplyr`, `plyr`, and `reshape2` - I recommend avoiding Excel and pivot tables if possible. – Max Ghenis Jun 23 '14 at 02:54
  • I'm guessing your data cleaning problems are more extensive than can be covered in the kinds of general questions your asking. You might want to look at OpenRefine.org. A few videos and a download might help you a lot with this part of your analysis. – John Jun 23 '14 at 02:58
  • It is going to be hard for people to provide you with helpful answers with the question in its current form. You might try splitting the questions into separate threads. You should also provide more details. Note that general questions about data cleaning will be on topic here, but the actual programming steps are a better fit for [Stack Overflow](http://stackoverflow.com/), so your subsequent questions may end up being migrated. – gung - Reinstate Monica Jun 23 '14 at 03:23
  • Thank you. Okay so forum etiquette dictates asking one question at a time per post. So split this into two questions... Also I note the negative votes, is there a better place to be posting these types of beginner questions? I'm not so much interested in actual steps, more so knowing where to even begin. Individual steps I figure can be looked up. – Wilkoe Jun 23 '14 at 03:24
  • OTOH, I don't think this question is so poor that it merits 3 downvotes. – gung - Reinstate Monica Jun 23 '14 at 03:24
  • OpenRefine looks like a great resource, I will start with that. As far as mapping and merging goes, not sure what that is but i will look it up. Thank you. – Wilkoe Jun 23 '14 at 03:30
  • 3
    This question appears to be off-topic because it is about rudimentary data cleaning and organization, not statistics. – Nick Stauner Jun 23 '14 at 03:48
  • 2
    I'd say it isn't off-topic because cleaning your data, as "rudimentary" as the process might be, is essential to using it. It's part of a larger issue. – shadowtalker Jun 23 '14 at 04:36
  • 2
    @NickStauner, IIRC I voted to close as 'unclear / needs more info', not as off-topic. It seems to me that data cleaning is within the scope of statistics writ large, & although I recognize good people can disagree, I think such questions can be on-topic. Consider that we have a [tag:data-cleaning] tag, & these CV threads: [1](http://stats.stackexchange.com/q/11659/7290), [2](http://stats.stackexchange.com/q/2768/7290), [3](http://stats.stackexchange.com/q/2910/7290), & [4](http://stats.stackexchange.com/q/7815/7290). – gung - Reinstate Monica Jun 23 '14 at 16:36
  • If changing words to numbers and assigning numbers to data collected as Likert ratings isn't rudimentary, I don't know what is. The part of the larger issue is analogous to the part of spelling in the larger issue of writing. @gung, given your stance on questions about working with software, I'm surprised to see you favoring this one. Granted, this one is less specific than most software questions, which I suppose can be construed as a good thing. It's not the same data cleaning as those old questions. Maybe "data entry" would fit better. Problem 2 isn't even a question, and yet, 6 upvotes now – Nick Stauner Jun 23 '14 at 18:47
  • Those are reasonable points, @NickStauner. Certainly 'how do I rearrange rows in R' would be off-topic. This question is ambiguous (in part due to the need for more info), it may well be off-topic ultimately. But if you look at the core of my answer, it discusses pros & cons of data cleaning in Excel vs R. I think that is (fuzzy, but potentially) on-topic. I'm also open to the idea that I'm wrong here. – gung - Reinstate Monica Jun 23 '14 at 18:58
  • @gung: yeah, your answer is great given the circumstances. I suppose the choice of Excel vs. R is worth considering in depth when changing "two" to "2", given all the permutations of that task and the size of some datasets, but TBH, I overlooked that sentence. I could see this being salvaged to focus on that issue or other things not covered already in almost any software's help files, but if that one element is clear enough and on-topic, I would like to see it emphasized, and the rest clarified or removed. That's my 2¢. I'm no mod of course, so no one ought to worry about my non-binding vote. – Nick Stauner Jun 23 '14 at 19:14
  • If you use stata, there is a reshape command that will do this for you easily. –  Aug 13 '15 at 03:11
  • This *is* the most usable form if Session id + User id is considered the key, as suggested by the second table: the original table appears to be in fourth Normal form. In one stroke, Excel will create the bottom table: it's called a "Pivot Table"--look for it in the menus and help system. It's harder to reverse the process. If these fields mean what they suggest, though, then (in principle) this table ought to be normalized by splitting it into two: one for users and another for sessions. – whuber Jan 04 '18 at 20:42

3 Answers3

12

As I noted in my comment, there isn't enough detail in the question for a real answer to be formulated. Since you need help even finding the right terms and formulating your question, I can speak briefly in generalities.

The term you are looking for is data cleaning. This is the process of taking raw, poorly formatted (dirty) data and getting it into shape for analyses. Changing and regularizing formats ("two" $\rightarrow 2$) and reorganizing rows and columns are typical data cleaning tasks.

In some sense, data cleaning can be done in any software and can be done with Excel or with R. There will be pros and cons to both choices:

  • Excel: Excel is almost certainly the most common choice for data cleaning (see R fortunes #59 pdf). It is also considered a poor choice by statisticians. The primary reason is that it is hard to ensure that you have caught everything, or that you have treated everything identically, and there is no record of the changes that you have made, so you can't revisit those changes later. The upside of using Excel is that it will be easier to see what you are doing, and you don't have to know much to make changes. (Statisticians will consider the latter an additional con.)
  • R: R will require a steep learning curve. If you aren't very familiar with R or programming, things that can be done quite quickly and easily in Excel will be frustrating to attempt in R. On the other hand, if you ever have to do this again, that learning will have been time well spent. In addition, the ability to write and save your code for cleaning the data in R will alleviate the cons listed above. The following are some links that will help you get started with these tasks in R:

    You can get a lot of good information on Stack Overflow:

    Quick-R is also a valuable resource:

    Getting numbers into numerical mode:

    Another invaluable source for learning about R is UCLA's stats help website:

    Lastly, you can always find a lot of information with good old Google:

    • This search: data cleaning in r, brings up a number of tutorials (none of which I've worked through, FTR).

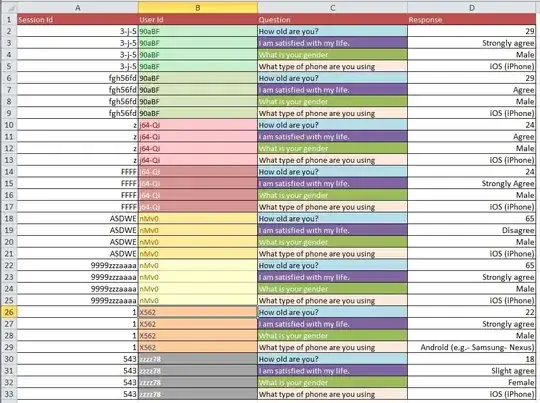
Update: This is a common issue regarding the structure of your dataset when you have multiple measurements per 'study unit' (in your case, a person). If you have one row for every person, your data are said to be in 'wide' form, but then you will necessarily have multiple columns for your response variable, for example. On the other hand, you can have just one column for your response variable (but have multiple rows per person, as a result), in which case your data are said to be in 'long' form. Moving between these two formats is often called 'reshaping' your data, especially in the R world.

  • The standard R function for this is ?reshape. There is a guide to using reshape() on UCLA's stats help website.
  • Many people think reshape is hard to work with. Hadley Wickham has contributed a package called reshape2, which is intended to simplify the process. Hadley's personal website for reshape2 is here, the Quick-R overview is here, and there is a nice-looking tutorial here.
  • There are very many questions on SO about how to reshape data. Most of them are about going from wide to long, because that is typically what data analysts are faced with. Your question is about going from long to wide, which is much less common, but there are still many threads about that, you can look through them with this search.
  • If your heart is set on trying to do this with Excel, there is a thread about writing a VBA macro for Excel to replicate the reshape functionality here: melt / rehshape in Excel using VBA?
gung - Reinstate Monica
  • 132,789
  • 81
  • 357
  • 650
  • 2
    This question, and this answer, is a great illustration of why programming literacy is increasingly necessary for pretty much any kind of research. I'm going to write up a fuller answer to this question that I'm also going to post on my blog, but I wanted to get this comment in before I forgot. – shadowtalker Jun 23 '14 at 04:37
  • 2
    I agree to some extent but "necessary" and "any kind of research" is going a bit far. A lot of disciplines don't often deal with dirty data and many leading researchers have never needed to touch a programming language. – Behacad Jun 23 '14 at 17:05
  • Wow, thank you all. It will take me a bit to process and integrate all of this information which is very new to me. A bit of a meta tangent it seems I spurred with my question... Imagine yourself dropped into a foreign land with no knowledge of its language/culture, this is me and stats. I appreciate the time you have all taken in your responding. – Wilkoe Jun 24 '14 at 05:34
  • I've added an edit in hopes of clarifying my initial question, though the question looks to be closed. – Wilkoe Jun 30 '14 at 02:28
  • The question is closed, @user48538, & this version is more clearly off-topic than the previous, unfortunately. If you have 10k rows, you definitely don't want to try to do this in Excel. You really have to use R or similar programming software. The name of the specific operation is to reshape your dataset from 'long' to 'wide', I will add a few more links for you. In addition, if you are an undergraduate volunteer, w/ little to no background in stats or programming, it was highly irresponsible of whoever to assign this task to you, IMHO. There is no way this should be your task. – gung - Reinstate Monica Jun 30 '14 at 02:45
0

Try following using R:

> ddf
   sess_id user_id     quest  response
1        1       a       age        29
2        1       a satisfied  st_agree
3        1       a    gender      male
4        1       a     phone    iphone
5        2       a       age        29
6        2       a satisfied not_agree
7        2       a    gender    female
8        2       a     phone    iphone
9        3       b       age        29
10       3       b satisfied     agree
11       3       b    gender      male
12       3       b     phone   android
> 
> library(reshape2)
> dcast(ddf, sess_id+user_id ~ quest, value.var='response')
  sess_id user_id age gender   phone satisfied
1       1       a  29   male  iphone  st_agree
2       2       a  29 female  iphone not_agree
3       3       b  29   male android     agree
rnso
  • 8,893
  • 14
  • 50
  • 94
0

In scala this is called an "explode" operation and can be done on a dataFrame. If your data is an rdd, you first convert to dataFrame via toDF command and then use the .explode method.

Lucas Roberts
  • 3,819
  • 16
  • 45