Is there a way to use strucchange package in R on ARIMA models? I haven't been able to find any. Thanks a lot.
Asked
Active
Viewed 3,498 times
3 Answers
13
The package strucchange requires as input the formula of a linear model to be passed to lm. I don't think there is a straightforward way to use the package with function arima. I don't know either any other R packages implementing this but I can give some basic guidelines that may be helpful for your purposes.
You can carry out some diagnostics based on the cumulative sum of squared residuals (CUMSUM) and based on F-tests for the parameters of the model in different subsamples.
Let's take for illustration the following simulated AR process, x. The first 50 observations are generated from an AR(1) model and the next 100 observations
from an AR(2) model:
set.seed(135)
x1 <- arima.sim(model = list(order = c(1,0,0), ar = -0.2), n = 50)
x2 <- arima.sim(model = list(order = c(2,0,0), ar = c(0.3, 0.5)), n = 100)
x <- ts(c(x1, x2))
CUMSUM approach: Once an AR model is fitted to the entire series the CUMSUM process can be obtained as follows:
fit <- arima(x, order = c(2,0,0), include.mean = FALSE)
e <- residuals(fit)
sigma <- sqrt(fit$sigma2)
n <- length(x)
cs <- cumsum(e) / sigma
As a reference, confidence limits can be obtained as done in package strucchange for the OLS-based CUSUM test. For that, we can create an object of class efp and plot it:
require(strucchange)
retval <- list()
retval$coefficients <- coef(fit)
retval$sigma <- sigma
retval$process <- cs
retval$type.name <- "OLS-based CUSUM test"
retval$lim.process <- "Brownian bridge"
retval$datatsp <- tsp(x)
class(retval) <- c("efp")
plot(retval)
The confidence limits are just for reference, I'm not sure they are the right
values to carry out a formal test in this context. Regardless of this, a sudden change or shift in the sequence cs can be interpreted as a sign that something is going on around that time point, possibly a structural change. In the plot we observe that at around observation 50, where we introduced a change in the data generating process.
F-tests: Another approach is based on F-test statistics computed as: $$ Fstat = \frac{RSS - USS}{RSS/n} $$ where RSS is the residual sum of squares in the restricted model (the model fitted for the entire data) and USS is the residual sum of squares of models fitted to two subsamples. The statistics can be computed iteratively for the following sequence of subsamples: from observations 1 to 20 and 21 to $n$; then from 1 to 21 and a next subsample from 22 to $n$, and so on as done below:
rss <- sum(residuals(fit)^2)
sigma2 <- fit$sigma2
stats <- rep(NA, n)
for (i in seq.int(20, n-20))
{
  fit1 <- arima(x[seq(1,i)], order = c(2,0,0), include.mean = FALSE)
  fit2 <- arima(x[seq(i+1,n)], order = c(2,0,0), include.mean = FALSE)
  ess <- sum(c(residuals(fit1), residuals(fit2))^2)
  stats[i] <- (rss - ess)/sigma2
}
Similarly to the CUMSUM plot, a plot of the F-statistics may reveal the presence of a structural change. A 95% confidence limit can be obtained based on the chi-square distribution.
plot(stats)
abline(h = qchisq(0.05, df = length(coef(fit)), lower.tail = FALSE), lty = 2, col = "red")
If the minimum p-value related to each statistic is below a significance level, e.g. 0.05, then we can suspect that there is a structural change at that point. In this simulated series that happens at observation 50, when the AR coefficients changed in the data generating process:
which.min(1 - pchisq(stats, df = 2))
#[1] 50
You may find further details in the vignette of the strucchange package
that you probably already know and in the references therein.
javlacalle
- 11,184
- 27
- 53
-
+ very nice and thorough answer. – forecaster Jul 02 '14 at 18:41
-
Thank you for this great answer. If there are multiple breakpoints, would I simply repeat the above process on each segment? For example, you identified a breakpoint at ```t = 50```. Should I take the segments ```[0, 50], [50, n]```, fit a new ARIMA model to each, and repeat the analysis to find other breakpoints? Or is there a better published method for detecting multiple breaks? – Frank Apr 06 '20 at 20:12
-
I simulated this with the F-test method you outlined, with 400 datapoints and a break at ```t = 50```. Every time I found a break ```x = t```, I cut off data ```x < t``` and performed the algorithm again. This gave breaks at ```49, 174, 245, and 310```, with P-values of ```0.000314, 0.00671, 0.02216, 0.0157``` The algorithm seems to consistently find breaks that are not there when applied iteratively. – Frank Apr 07 '20 at 22:05
-
1@Frank The ideas in this answer gave an overall idea about how to adapt the methods already available in strucchange to the case of ARIMA models. There is literature specific for the detection of structural breaks in time series, see for example the references given [here](https://stats.stackexchange.com/questions/150998/equivalence-of-regression-models-and-arima-models/151002#151002). – javlacalle Apr 08 '20 at 19:45
-
1@Frank It's interesting to see that the method shows a sensible performance in the simulation exercise. The issue that I see with using segments is that not all the data are used at the same time. The standard deviation of parameters may be higher and this may affect the test if no break is actually present. Anyway, with a relatively large sample as the one in your example, it seems a sensible approach to try. – javlacalle Apr 08 '20 at 19:47
-
I wish I could post the code but too long. It may actually work if I use critical p-values below 10^-4, I'm trying to work out a good critical value. Unsure why they are so low though. I'm using ```which.min(1 - pchisq(stats, df = length(coef(fit)))``` – Frank Apr 08 '20 at 19:51
-
1@Frank Instead of segments like [0-50], [51-100], [101-150],... it could be interesting to use a moving window, e.g.: [0-50], [10-60], [20-70], ... and see the behavior of the statistic for structural break at each point. For example, see if there is a spike when the window enters an observation,... The distribution of the statistic at a given observation in this moving-window-approach may in fact have a distribution under the null of no break, which could be worth exploring by simulations and perhaps analytically, but this would require some further thought. – javlacalle Apr 08 '20 at 19:52
-
1@Frank Finally, another possibility is an iterative process in which ARIMA models are fitted to different segments as new structural breaks are found. For example, if a break is found at observation 60, then fit an ARIMA model for the first 60 observations an another for the remaining observations. Then reassess the significance of the break and test for another break given the last accepted multi-ARIMA model. If interested in a similar idea, see e.g. the documentation of the software [TRAMO](https://en.wikipedia.org/wiki/TRAMO) or [tsoutliers](http://cran.r-project.org/package=tsoutliers). – javlacalle Apr 08 '20 at 19:56
-
@javlacalle Thank you for the references. I will read them and consider the moving window. Also thanks for replying because I know this post is very old. You have helped me a lot. – Frank Apr 08 '20 at 20:01
0
I have blogged about detecting structural break using the strucchange package in R. It is pretty straight forward - here's the outline:
# assuming you have a 'ts' object in R

# 1. install package 'strucchange'
# 2. Then write down this code:

library(strucchange)

# store the breakdates
bp_ts <- breakpoints(ts)

# this will give you the break dates and their confidence intervals
summary(bp_ts)

# store the confidence intervals
ci_ts <- confint(bp_ts)

## to plot the breakpoints with confidence intervals
plot(ts)
lines(bp_ts)
lines(ci_ts)
The time series data used in my blog happens to be an ARIMA(0,1,1) process. If you want to verify that, check my Github repo regarding the same.
Anirudh
- 31
- 5
-
Your blog post seems neat, however we prefer if the answers on this site are self contained. You could improve your answer be adding a bit about the method (how, and why it works for example). – Repmat Nov 16 '16 at 16:16
-
1@Repmat I'll surely improve my answer in a while, with more details on the method, the motivation and how it works. – Anirudh Nov 16 '16 at 16:33
0
If you want to check the existence of structure breaks, I would recommend you to:
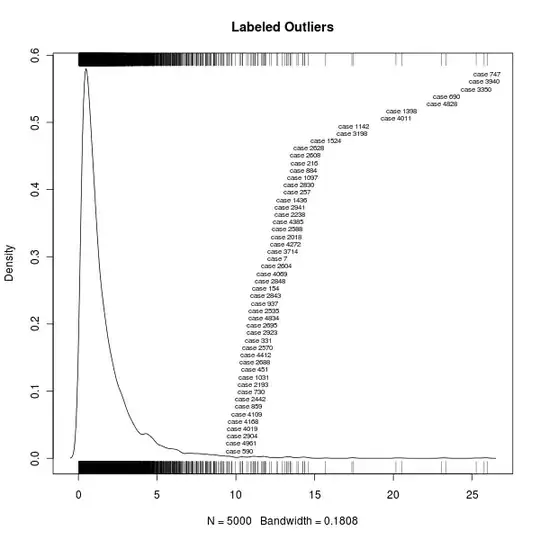
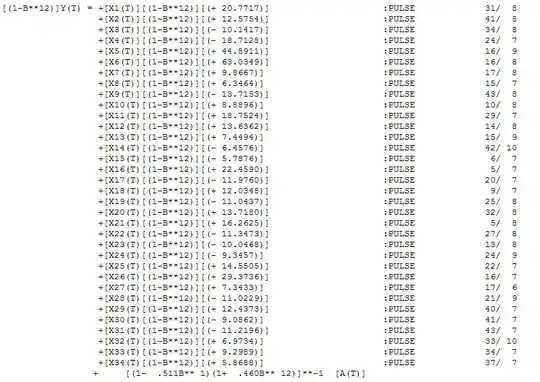
Make outliers analysis, with the package
tsoutliers. By using the functiontso, you can check if your model has an isolated spike (additive outlier), an abrupt change in the mean level (level shift), a spike that takes a few periods to disappear (transient change) or a shock in the innovations of the model (intervention outlier).Analyse the stability of parameters through the QLR test (see critical values in Andrews, 2006). This test is most appropriate when: i) the break date is unknown, ii) the lagged variable is an explanatory variable e/or iii) the errors are heteroscedatic / autocorrelated.
To run this test, you have to add dummies to your model and make loop, in which regressions are calculated several times and the value of the dummies is changed over the time in order to capture possible breaks.
#Define the window to be tested. In general, the first and last 15% observations are excluded
window_breaks <- seq(inic_anomes, last_anomes, 1/12)

# Loop to run the regressions and compute the test statistic
for(i in 1:length(window_breaks)) {

  # Set up dummy variable
  D <- time(y) > window_breaks[i]

  # Estimate model with dummy
  model <- lm(y ~ x + D + D*x)

  # Compute and save the F-statistic
  Fstats[i] <- linearHypothesis(model,
                                c("D", "x:D"),
                                vcov = kernHAC)$F[2]
}

QLR <- max(Fstats) #if QLR < critical value, there is no break
hrbs
- 11
- 1