6

What type of graph is this developer using?

graph

Copied from here.

Jeromy Anglim
  • 42,044
  • 23
  • 146
  • 250
hanleyhansen
  • 163
  • 4

3 Answers3

9

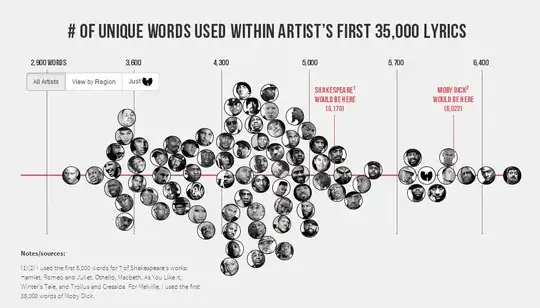
It is the beeswarm version of a stripchart, with photos of the artists in place of dots.

gung - Reinstate Monica
  • 132,789
  • 81
  • 357
  • 650
  • Awesome. Beeswarm looks like the way to go. Now to implement this with matplotlib using pandas DataFrames! – hanleyhansen Jun 09 '14 at 21:37
  • The "closely-packed" criterion for a beeswarm does not seem to apply to the example. Accepting this (for the nonce) as an *intended* beeswarm gives us a novel example of a significant [lie factor](http://www.datavis.ca/gallery/lie-factor.php) :-). – whuber Jun 09 '14 at 22:53
  • @hanleyhansen: [seaborn](http://seaborn.pydata.org/) has a beeswarm plot function that works nicely with pandas DataFrames. – Schmuddi Jan 07 '17 at 13:04
  • @hanleyhansen You're welcome. Be aware that seaborn doesn't support photo beeswarms, though. :) – Schmuddi Jan 07 '17 at 18:22
7

There is a single numeric axis against which values are plotted and there is some mix of stacking and jittering to separate points that might occlude or overlap each other. Short of the photos, which make the graph distinctive, I have come across the following names for broadly similar plots:

barcode charts beeswarm plots circle plots column scatter plot data distribution graph dispersal graphs dispersion diagrams dit plots dot array charts dot charts dot diagrams dot histograms dot patterns dot plots instance chart line charts line plots linear plots needle plots number-line plots one-axis data distribution graph one-dimensional scatter plots oneway graphs oneway plots point graphs raster plots strip charts strip plots stripe graph stripes plot unidimensional scatter plots univariate scatter plots Wilkinson dot plots

plus several variations of those running words together or using different hyphenation, which I am not quite crazy enough to collect.

Stata users might care to note that these are documented in the help for my stripplot command available from SSC.

Nick Cox
  • 48,377
  • 8
  • 110
  • 156
4

This is a dot chart with some non-random jittering for legibility.

It it not a dot plot, though there's some superficial similarity.

dimitriy
  • 31,081
  • 5
  • 63
  • 138
  • 1
    There is some superficial similarity, but I would say dot plots usually have many lines with only one or few dots per line. – gung - Reinstate Monica Jun 09 '14 at 21:37
  • 1
    @gung I think of dot plots as having a histogram-like component that is (or should be) mostly absent here. Judging by the responses here, that is probably not a widely shared view. I was hoping to point out that the artists just shy of 3,600 should be arrayed horizontally given their vocabulary size values, but their current position creates an illusion of a mass point that is unfortunate since this chart is not really a histogram. – dimitriy Jun 09 '14 at 21:56
  • Yeah, I think these names are ultimately somewhat subjective & even arbitrary. @NickCox's post documents some of that. I was just commenting that I wouldn't really call this a "dot plot", but it's a reasonable name nonetheless; I upvoted it anyway. – gung - Reinstate Monica Jun 09 '14 at 21:59