The significance of the main effects are going to depend on how your data is coded.
One real example that I deal with regularly where there is potential for significant interactions and non-significant main effects is:
Predictor 1, group: 0-control 1-treatment
Predictor 2, time: 0-pre intervention 1-post intervention
So the main effect on group (predictor 1) is measuring the difference between the treatment and control groups before any intervention takes place. If subjects were randomly assigned to group then this should not be significant. Even in an observational study without randomization this could be non-significant if the groups were chosen to be similar.
The main effect on time measures the change in the response between the pre intervention time period and the post intervention time period. If the response is not changing over time (due to outside effects or contamination from treatment group) then this should be non-significant as well. When it is not 0 (it is significant) it is an indication of any time effect/drift.
The interaction is then what is of interest, it is the change in the treatment group after intervention adjusting out any effect of differences between the groups to begin with and any drift over time.
In an ideal situation both main effects will be 0 and the interaction will not be. But there are cases where either main effect could be non-0.
Note that in the ideal situation (both groups identical at baseline, no change in control group over time) if we code the control group as -1 instead of 0 and the pre time as -1 instead of 0, then the main effect definitions change and the expectation of them being 0 is no longer the case.
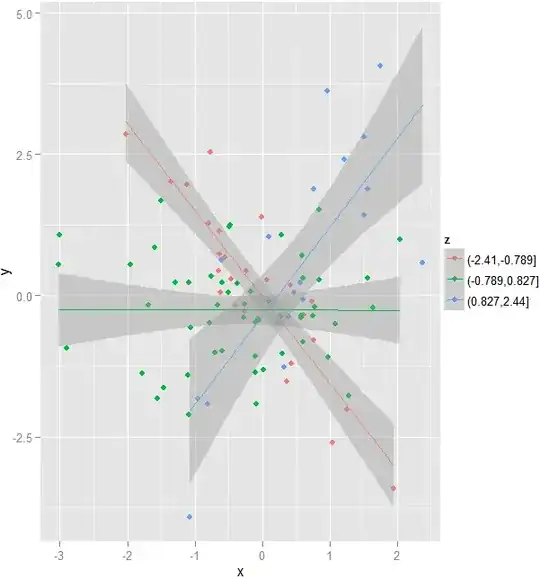
 Here the slope of
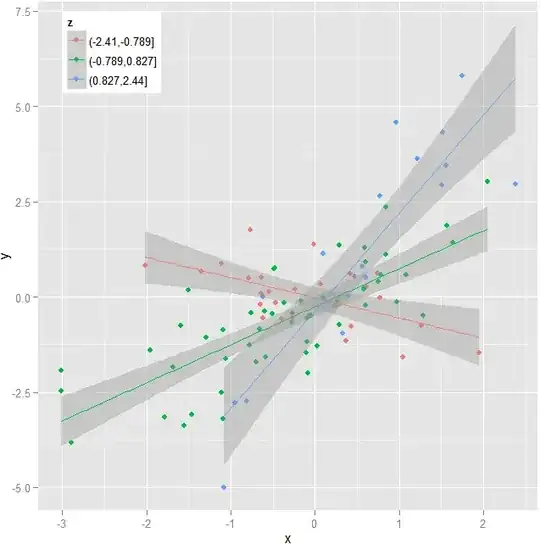