7

I am trying to generate a simulated data matrix that is correlated by both observation and variable directions. So far I know how to do this for variable x variable.

enter image description here

 # correlated matrix between variables 
    n = 200
    p = 100 
    CRMt <- matrix(NA, nrow = p, ncol = p)
    diag(CRMt) <- 1
    CRMt[upper.tri (CRMt, diag = FALSE)] <- 0.5
    CRMt[lower.tri (CRMt, diag = FALSE)] <- 0.5

L = chol(CRMt)# Cholesky decomposition
p = dim(L)[1]

set.seed(999)
M = t(L) %*% matrix(rnorm(p*n), nrow=p, ncol=n)
M1 <- t(M)
rownames(M1) <- paste("S", 1:200, sep = "") 
colnames(M1) <- paste("M", 1:100, sep = "")
cor(M1)

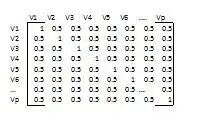
Now say I want to create a data matrix that also follows the following observation x observation correlation matrix.

enter image description here

OCRMt <- matrix(NA, nrow = n, ncol = n)
diag(OCRMt) <- 1
OCRMt[upper.tri (OCRMt, diag = FALSE)] <- 0.3
OCRMt[lower.tri (OCRMt, diag = FALSE)] <- 0.3

How can I do this ?

Ram Sharma
  • 2,226
  • 3
  • 20
  • 24

1 Answers1

7

You can do the same thing that you did to the columns of the matrix to make them correlated, just do it to the rows instead. This will adjust the correlation on the observations within a column without affecting the correlations between the columns much:

L = chol(OCRMt)# Cholesky decomposition
p = dim(L)[1]

M2 <- t(L) %*% M1

hist( cor(M2)[ lower.tri(cor(M2), diag=FALSE)])
hist( cor(t(M2))[ lower.tri(cor(t(M2)), diag=FALSE)])

You can also create one observation from a distribution with n times p columns, then wrap that into your matrix. The correlation matrix is the Kronecker product of your other correlation matrices. My computer ran out of memory for your example, but works for a smaller matrix:

library(MASS)
vcmat <- matrix( 0.5, 10,10 )
diag(vcmat) <- 1

ocmat <- matrix( 0.3, 20,20 )
diag(ocmat) <- 1

cmat <- kronecker( ocmat, vcmat )

obs <- matrix( mvrnorm(1, mu=rep(0,10*20), Sigma=cmat), 20, 10 )

hist(cor(obs))
hist(cor(t(obs))) 
Greg Snow
  • 46,563
  • 2
  • 90
  • 159
  • 1
    Greg, can you give, please, a numeric example in line with your code? For people not using `R` to be able to repeat your idea outside of `R`? – ttnphns Jun 05 '14 at 06:44
  • @ttnphns, For the 1st example I just multiply the Cholesky decomposition of the correlation matrix by the matrix of the data and that creates the correlation among the rows. In the second case I computed the Kronecker product of the 2 correlation matrices and used that as the correlation structure for a single observation (could have multiplied it by a single column of iid normals), then wrapped the resulting vector into a matrix of the desired dimension. – Greg Snow Jun 05 '14 at 17:47